


Talking Points:
- The ONE Thing: The drop in price aligns with the shrinking premium seen on front month future’s contracts compared to later-dated contracts. Traders should keep an eye to see whether or not the recent blast of supply is sustained, and if not, whether the upside could continue in crude oil.
- Per BHI, U.S. total count drops to 1,046
- The technical picture warrants attention as a potential bullish reversal that would be confirmed above $71/bbl (spot at $68.25)
- Crude falls for the week ahead of key earnings from Exxon & Shell as well as Chinese Energy Data
Fundamental Forecast for <USOIL>: Neutral
Crude opened the first day of trading last week with a sharp drop below $68/bbl only to seemingly find price and buyer support near $67/bbl. While the outlook appeared concerning with trade war headlines dominating terminals, news broke that Saudi Arabia, who previously increased supply to reduce price pressure for oil product users may not pump so much after all.
The news that new Saudi and OPEC oil may not be flood the market helped to foster an apparent turnaround. WTI popped back above the 50-DMA on the news, which provides hope for the beleaguered Bulls. Another key development last week was the narrowed spread between front-month Brent and WTI, which had been near historic highs earlier this year with a compliant OPEC and a drill and pump-happy United States.
Another factor that crude oil has been susceptible to alongside other assets is risk sentiment. While risk sentiment (basically, emotions and outlooks of traders and investors) are very volatile, they are a key driver of price action and the jump in risk aversion aligned with the drop in price on Monday.
Once again, WTI and Brent crude has become the market everyone is discussing! Unlock our forecast here
Crude Oil Holds Above Broad Support with Concerning Macro Fundamentals
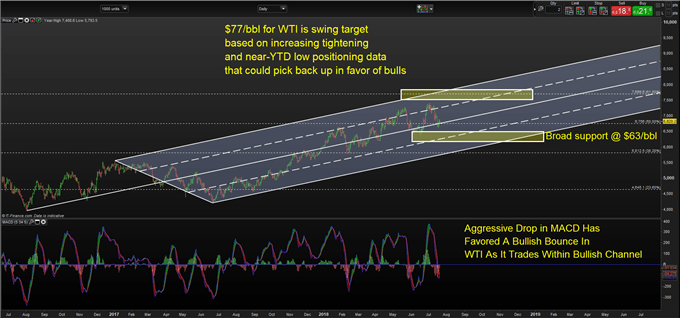
Chart Source: Pro Real Time with IG UK Price Feed. Created by Tyler Yell, CMT
Crude oil has fallen aggressively within the broader uptrend. Traders can look to MACD (5, 34, and 5) that is below the price chart above to identify how sharply price has fallen. However, within the broader uptrend, traders are right to wonder if a bullish turnaround may be around the corner.
From a trend following standpoint, betting on a broad trend reversal from multi-year and multi-month bullish to overtly bearish is often a low probability bet. Therefore, a trend continuation is a preferred route, which I hold though it’s likely too early to say confidently that a bullish reversal is at hand. Rather, I would say it is around the corner, if not already in the works as the chart below better helps to explain.
Crude Oil Price Chart with Elliott Wave Analysis Applied
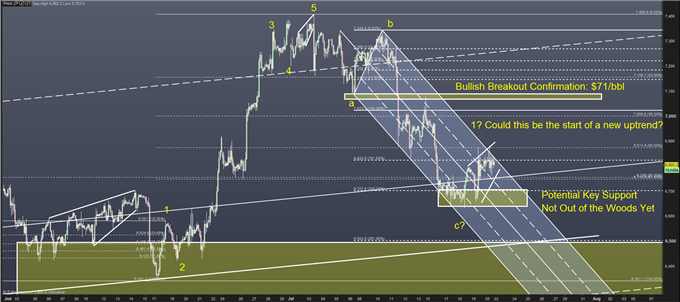
Chart Source: Pro Real Time with IG UK Price Feed. Created by Tyler Yell, CMT
The drop in price aligns with the increase of supply from Saudi that was initiated by US President Trump request. However, the technical outlook doesn’t seem to favor a further drop in price. As the first longer-term chart points out, there is broader support at $63/bbl. However, above there is short-term support near $67/bbl that traders should watch.
The labels on the price chart above align with the Elliott Wave theory, which posits that price trends move in waves, and can help to paint the possible future scenarios in markets. We put a guide together on this theory of technical analysis here.
The takeaway from the levels is that price may be in the early stages of a bullish reversal. However, we remain in a bearish channel, which could make a bullish call fragile or premature.
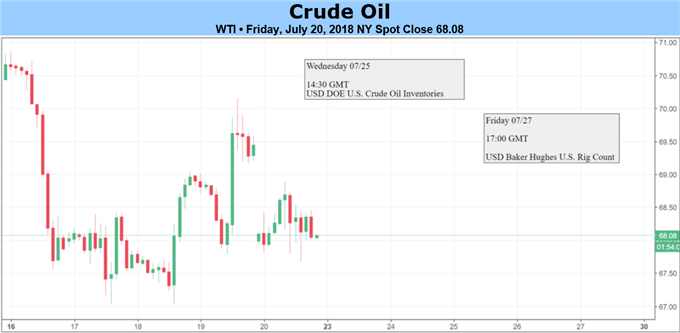
Next Week’s Data Points That May Affect Energy Markets:
The fundamental focal points for the energy market next week:
- Monday 02:30 AM ET: China June commodities & energy trade data (final)
- Tuesday 09:00 AM ET: EIA releases International Energy Outlook 2018
- Tuesday 4:30 PM ET: API Weekly Oil Inventories Report
- Wednesday 10:30 AM ET: EIA issues weekly US Oil Inventory Report
- Thursday: Shell, Repsol, Total earnings
- Friday: Exxon Mobil, Chevron, Pemex, Eni earnings
- Friday 1:00 PM ET: Baker-Hughes Rig Count
- Friday 3:30 PM ET: Release of the CFTC weekly commitments of traders report on U.S. futures, options contracts
---Written by Tyler Yell, CMT
Tyler Yell is a Chartered Market Technician. Tyler provides Technical analysis that is powered by fundamental factors on key markets as well as trading educational resources. Read more of Tyler’s Technical reports via his bio page.
Communicate with Tyler and have your shout below by posting in the comments area. Feel free to include your market views as well.
Talk markets on twitter @ForexYell


