
Advertisement
Advertisement
Crude Oil Price Update – Major Retracement Zone at $66.95 to $65.92 Controlling Longer-Term Direction
By:
Based on the early price action, the direction of the October WTI crude oil market is likely to be determined by trader reaction to the main 50% level at $66.95.

U.S. West Texas Intermediate crude oil futures are trading higher early Tuesday after a report from OPEC confirmed that top exporter Saudi Arabia had cut production to avert looming oversupply. Early Monday, crude oil broke sharply on fears of lower demand, however, the market regained most of those losses after the release of the report on Saudi Arabia.
At 0514 GMT, October WTI crude oil futures are trading $66.79, up $0.22 or +0.33%.
Daily Swing Chart Technical Analysis
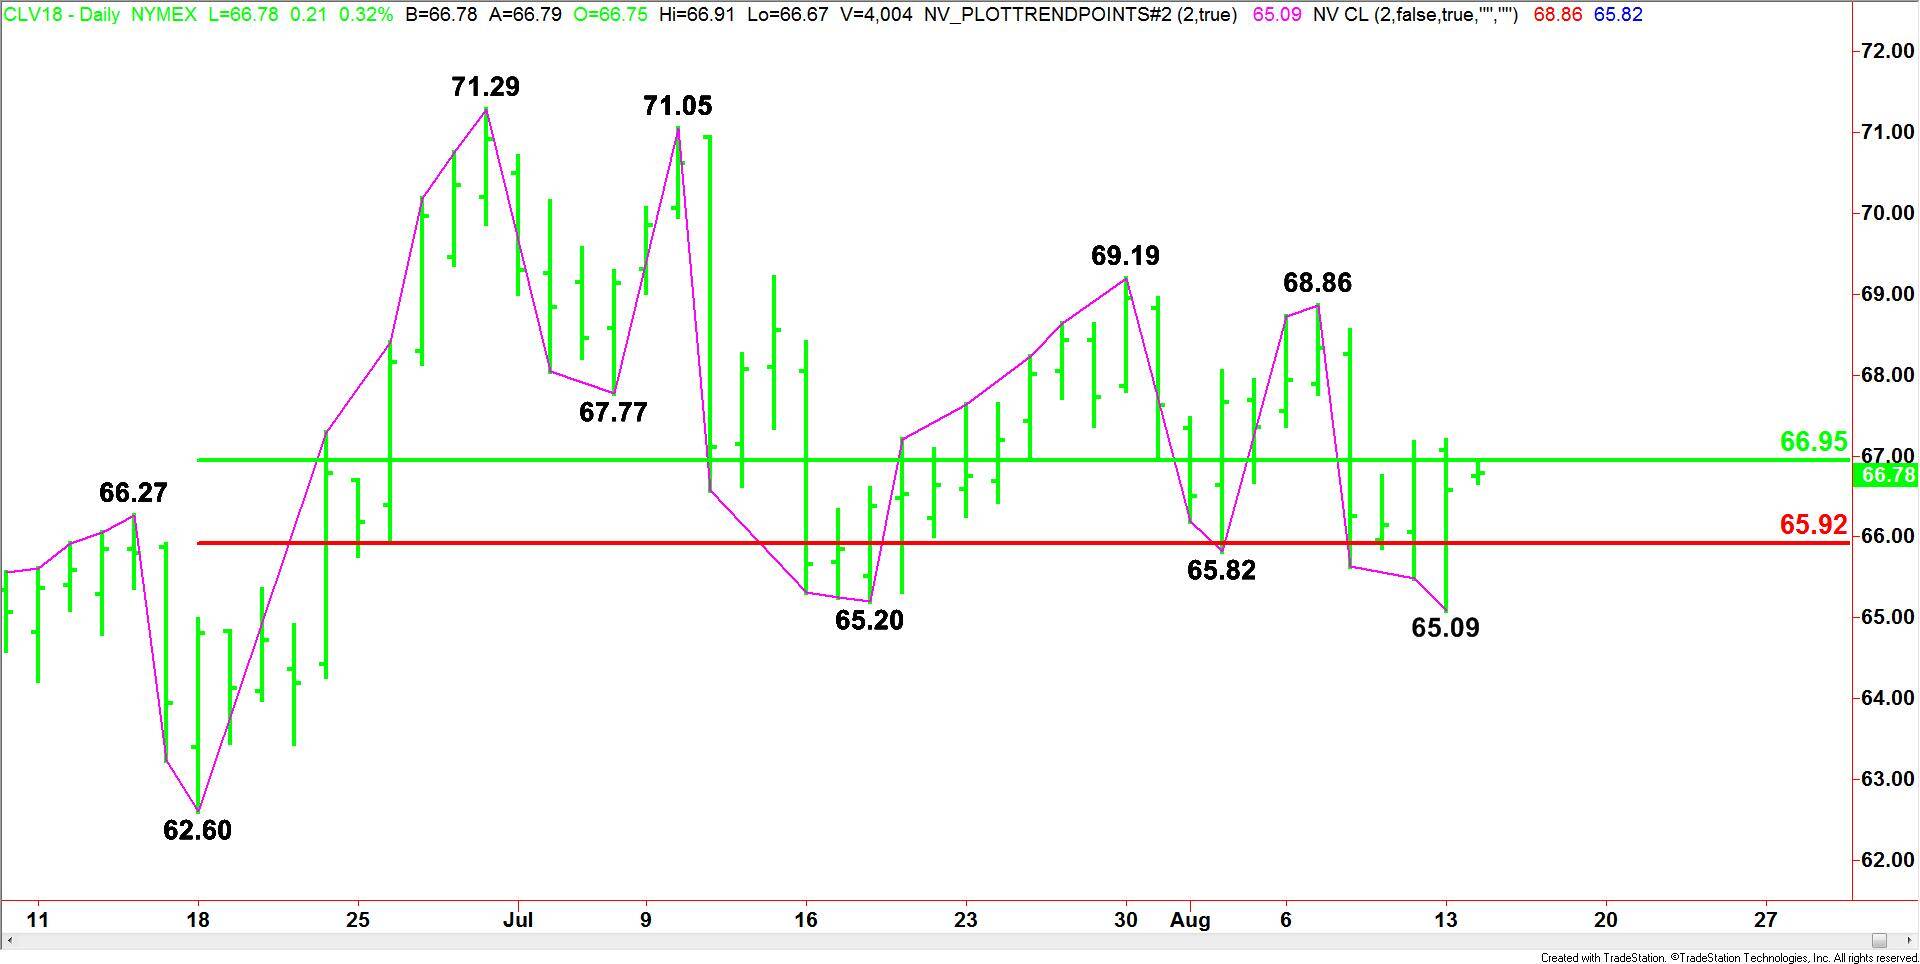
The main trend is down according to the daily swing chart. The downtrend was reaffirmed on Monday when sellers took out the precious main bottom at $65.20. A sustained move under $65.09 will signal a resumption of the downtrend. The daily chart is wide open under this level with $62.60 the next major downside target. The main trend will change to up on a trade through $68.86.
The minor trend is also down. A trade through $67.19 will change the minor trend to up. This will also shift momentum to the upside.
The main range is $62.60 to $71.29. Crude oil is currently straddling its retracement zone at $66.95 to $65.92. This zone is controlling the longer-term direction of the market. On Monday, sellers took out the lower end of this zone, but strong buying has now put the market in a position to challenge the upper boundary.
Daily Swing Chart Technical Forecast
Based on the early price action, the direction of the October WTI crude oil market is likely to be determined by trader reaction to the main 50% level at $66.95.
A sustained move under $66.95 will indicate the presence of sellers. If this generates enough downside momentum, we could see a break into the main Fibonacci level at $65.92. A failure to hold this level could drive the market into yesterday’s low at $65.09. This is another trigger point for an acceleration to the downside.
Overtaking and sustaining a rally over $66.95 will signal the presence of buyers. However, the trigger point for a potential breakout to the upside is $67.19. Since the main trend is down, sellers may return as crude approaches the pair of main tops at $68.86 and $69.19.
About the Author
James Hyerczykauthor
James is a Florida-based technical analyst, market researcher, educator and trader with 35+ years of experience. He is an expert in the area of patterns, price and time analysis as it applies to futures, Forex, and stocks.
Did you find this article useful?
Latest news and analysis


Advertisement