


Precious metals continued their sell-off yesterday, and while perhaps short-term oversold, momentum could continue to carry them lower. WTI crude oil posted a bullish key-reversal yesterday around a very important slope extending higher from last summer. The DAX is trading around long-term trend support while U.S. indices fail to bring in conviction of any kind just yet, however; we did look at a weekly
Technical Highlights:
- Gold & silver undergo another round of selling
- WTI crude oil posts key-reversal at slope from July of last year
- The DAX is trading around important long-term support
- Bonus chart: Nasdaq 100 weekly = topping potential
See how the majority of traders are positioned in various markets/currencies and what it says about future price fluctuations – IG Client Sentiment
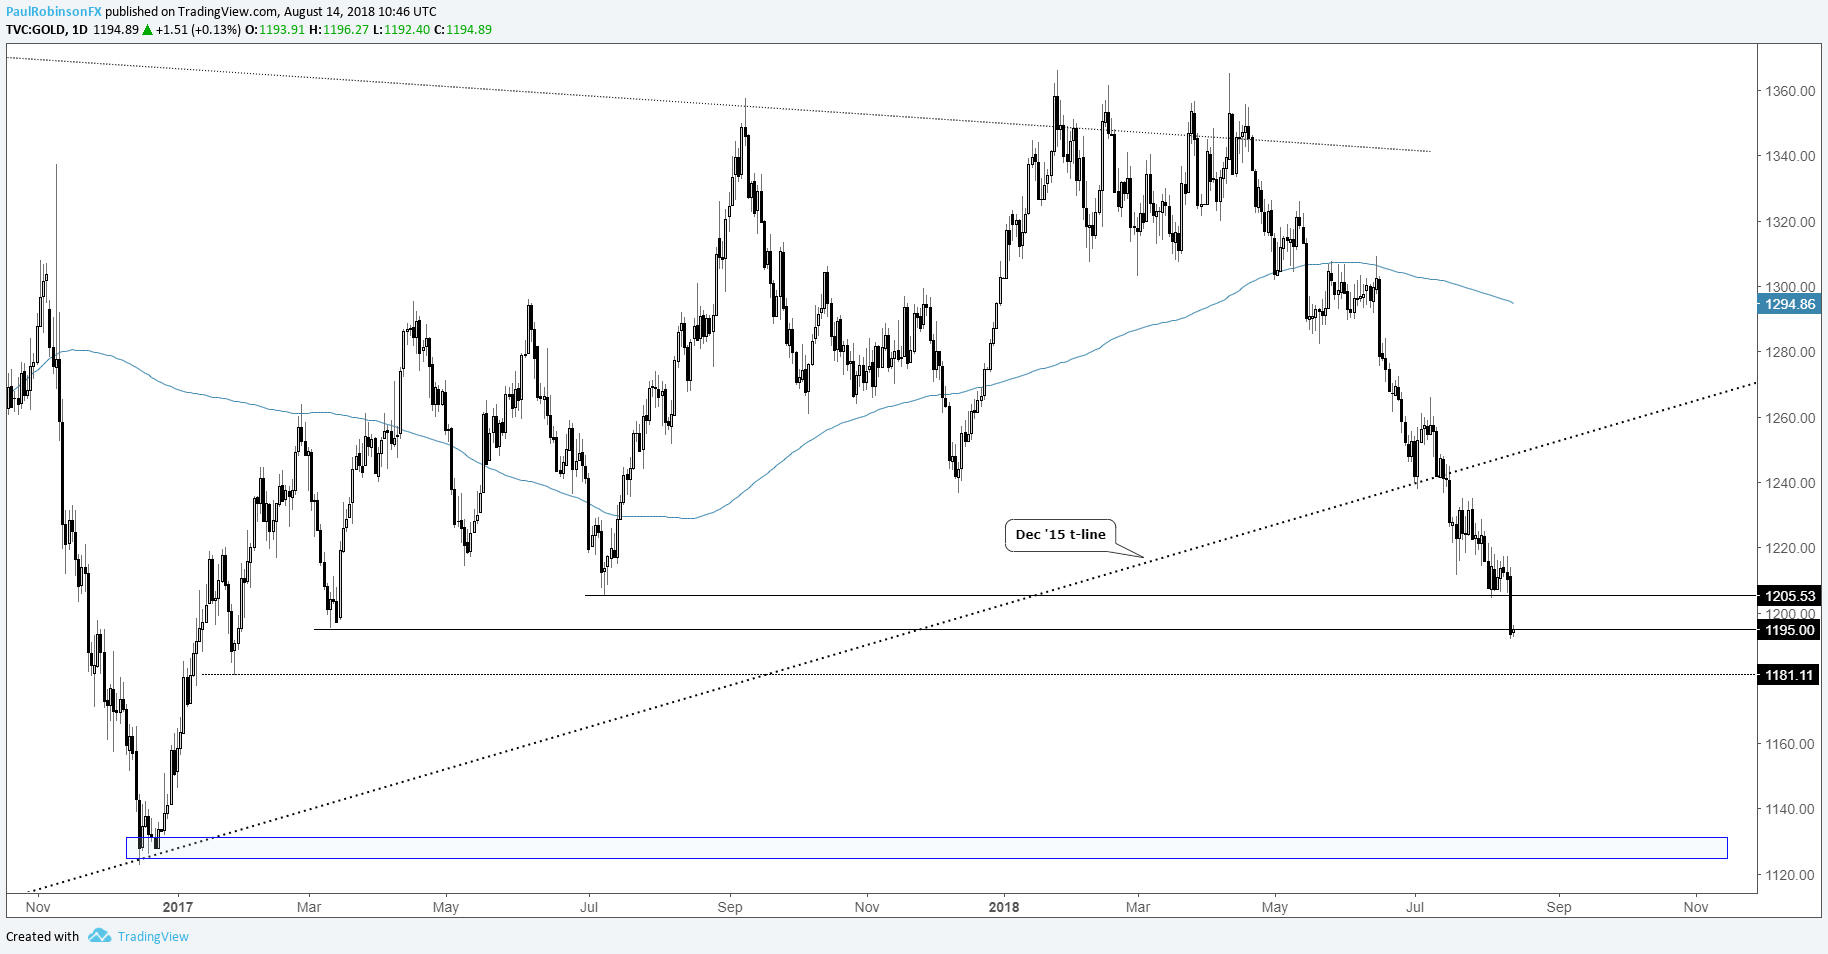
Gold & silver undergo another round of selling
Gold and silver got worked some more yesterday, with the latter falling down out of the descending wedge we were looking at last week. Both are in an extended state again in the short-term, but appear likely to continue lower.
Tactically, it’s a tough spot again as fresh shorts hold risk without a bounce and longs aren’t appealing with no sturdy support at hand along with bullish price action. Another round of consolidation could provide a decent set-up for shorts. If short from good prices then utilizing a trailing stops of sorts would be a prudent move.
Gold Price Daily Chart
For more in-depth fundamental and technical analysis, check out the Q3 Forecast for Gold
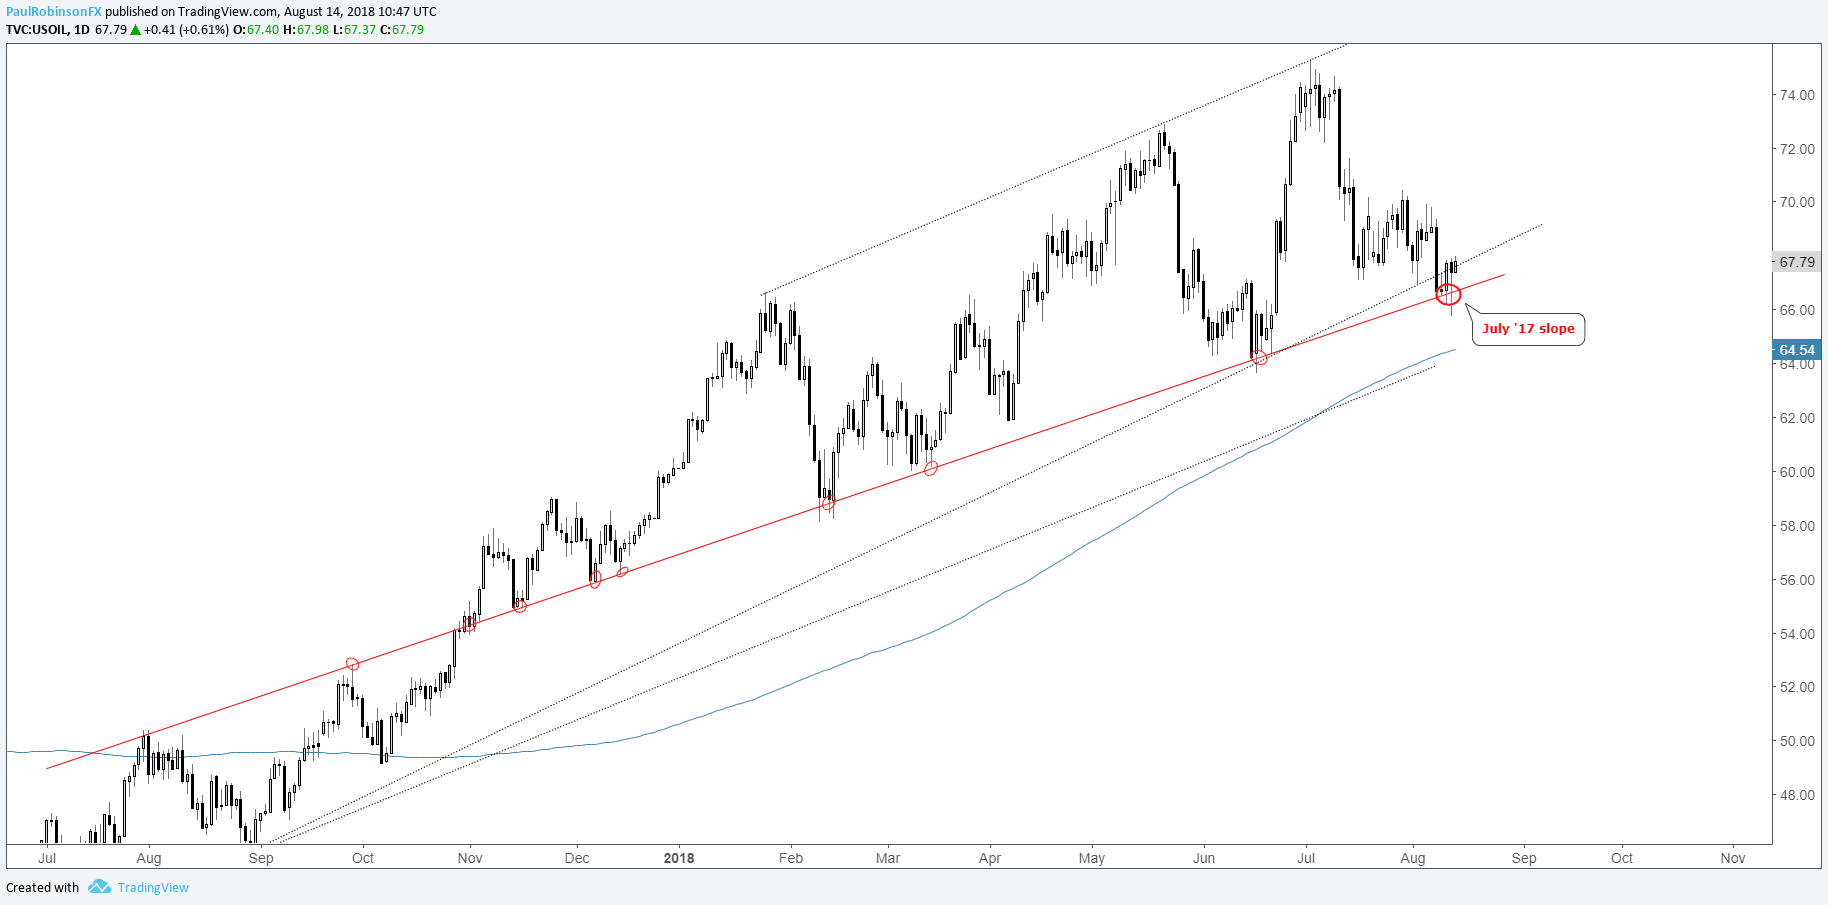
WTI crude oil posts key-reversal at slope from July of last year
The July ‘17 slope is in play again, finally. We’ve been discussing it a lot lately thinking it would get tested sooner rather than later. Yesterday’s key reversal off the slope further solidifies its importance, and as far as we’re concerned it is a macro line-in-the-sand.
Give it the benefit of the doubt from the long-side, as so far, any sizable sell-off in recent history has been cut short at the slope before seeing price trade higher. It may be different this time, but for as long as it holds the trend needs to be respected. Break below, then we can start talking about changing gears.
WTI Crude Oil Daily Chart (Reversal at July ’17 slope)
For more in-depth fundamental and technical analysis, check out the Q3 Forecast for Crude Oil
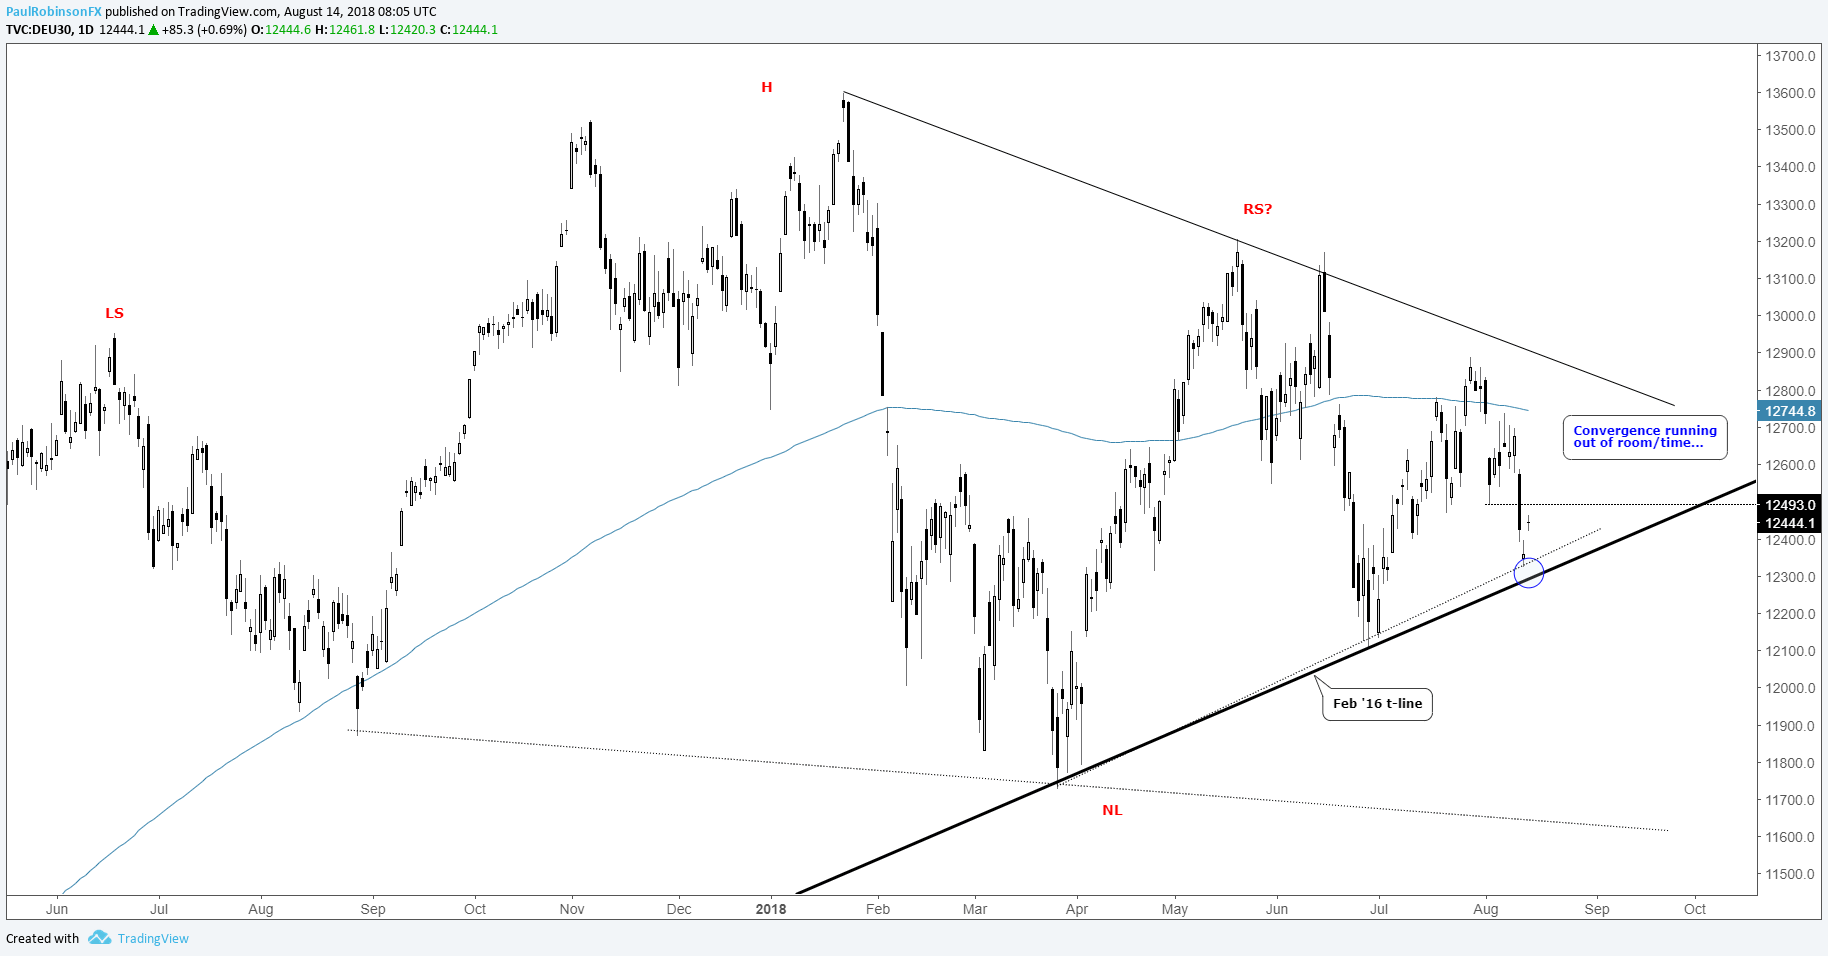
The DAX is trading around important long-term support
This morning we looked at the DAX as it trades around the February 2016 trend-line. So far it is holding and we’ll run with it as support until broken. We also discussed the convergence in price action since January. As we head towards a busy time of the year again, that convergence is likely to be freed up.
There is still the possibility for the macro head-and-shoulders from June of last year to trigger, which would certainly be quite the bearish event. For now, we may not see anything exciting through the end of this month as market participation is light.
For more in-depth fundamental and technical analysis, check out the Q3 Forecast for Global Equity Indices
DAX Daily Chart (Feb '16 t-line)
Bonus chart: Nasdaq 100 weekly = topping potential
The Nasdaq 100 weekly chart holds very intriguing prospects, as the rising wedge which has been developing throughout the year is nearing the apex and as we arrive at the weakest time of the year. The Nasdaq 100 is predominately driven by a small handful of major companies (FAANG + Microsoft), and as such, if these crack then the whole market goes with them. This would likely lead to the much-anticipated risk-off trade across all asset classes gaining full traction, something we’ve seen start to unfold only to stop without showing all its teeth. We’ll delve into this further, so stay tuned…
Nasdaq 100 Weekly Chart (Rising Wedge)

Resources for Index & Commodity Traders
Whether you are a new or an experienced trader, DailyFX has several resources available to help you; indicator for tracking trader sentiment, quarterly trading forecasts, analytical and educational webinars held daily, trading guides to help you improve trading performance, and one specifically for those who are new to forex.
---Written by Paul Robinson, Market Analyst
You can follow Paul on Twitter at @PaulRobinsonFX


