


The US Dollar has burst up to fresh yearly highs over the past few trading days, starting on Friday morning as EUR/USD price action began to plunge through the 1.1509 support level that had held up for the past couple of months. That theme of USD strength has largely remained ever since, with USD gapping-up on the open and running into a long-term Fibonacci level around 96.47. That resistance held into this morning, at which point USD bulls pushed through to fresh higher-highs along with the prospect of more.
Talking Points:
- If you’re looking to improve your trading approach, our Traits of Successful Traders research could help. This is based on research derived from actual results from real traders, and this is available to any trader completely free-of-charge.
- If you’re looking for a primer on the FX market, we can help. To get a ground-up explanation behind the Forex market, please click here to access our New to FX Trading Guide.
If you’d like to sign up for our webinars, we host an event on Tuesday and Thursday, each of which can be accessed from the below links:
Tuesday: Tuesday, 1PM ET
Thursday: Thursday 1PM ET
US Dollar Breaks Out and Runs to Fresh Yearly Highs
The big item of interest since our last webinar on Thursday was the topside breakout in the US Dollar. The last time we looked at USD, we remarked on the potential for topside breakouts to fresh highs, specifically citing resistance potential at 96.00 and 96.47, which is the 23.6% Fibonacci retracement of the 2011-2017 major move in USD.
US Dollar Monthly Price Chart: February Support at the 50, August Resistance at the 23.6

Chart prepared by James Stanley
That 96.47 level was the initial target for our US Dollar Q3 Technical forecast, and this came into play shortly after this week’s open, helping the Dollar to hold resistance into this morning. A few hours after today’s US open, bulls would take no more and pushed through to fresh highs. At this point, that area of resistance becomes potential short-term support for bullish continuation in USD. And the prior area of resistance can also be re-utilized for support potential.
US Dollar Four-Hour Price Chart

Chart prepared by James Stanley
The big question now is what might be able to elicit a pullback. This week’s economic calendar is rather light, with but a few high-impact items of interest. One item that may be compelling is tomorrow’s UK inflation report, as this had helped the Dollar to form a bottom in mid-April, just ahead of the start of that aggressively bullish run that continues today.
DailyFX Economic Calendar: A Light Outlay for the Rest of This Week

Chart prepared by James Stanley
Euro Bears Pulling No Punches as the Down-Trend Heats Up
We looked at resistance plays around bearish continuation in EUR/USD as part of our FX setups for this week. But, as we wrote this morning, a short-term range had built-in without encountering that potential resistance around 1.1445, and sellers have remained active here, pushing prices down to fresh lows shortly after this morning’s US open.
The door appears to be open for bearish continuation, and we looked at a couple areas of interest that could be used with that theme, essentially taking the support and resistance area from that short-term range to re-apply for bearish continuation.
EUR/USD Four-Hour Price Chart

Chart prepared by James Stanley
GBP/USD Oversold and in the Spotlight for UK Inflation
This year has been a tale of two trends in GBP/USD. The pair came into the year with considerable strength, being driven by a combination of higher rates of inflation along with a Central Bank that appeared ready and able to address that inflation with rate hikes.
But that case started to dissolve in April as inflation drew down, putting the BoE in a defensive posture in which they didn’t want to hike in May in the face of falling inflation. Inflation has only continued to fall since then, with the past three months printing at one-year lows of 2.4%. But – the BoE still felt compelled to hike at their August rate decision a couple of weeks ago. In a somewhat puzzling move, the bank sounded rather pessimistic towards future operating conditions, even suggesting that rate cuts may be needed should Brexit negotiations create considerable discord. Begging the question – why then hike rates?
Regardless – the dovish nature with which that rate hike went down further dissolved the bullish case behind the British Pound and the pair has been in a hard-sell mode since.
We looked at lower-high resistance plays for bearish continuation in yesterday’s article entitled, GBP/USD: Cable Attempts to Carve Out Support, But Can it Hold? The first resistance area we looked at came into play and prices have continued to slide-lower.
GBP/USD Hourly Price Chart
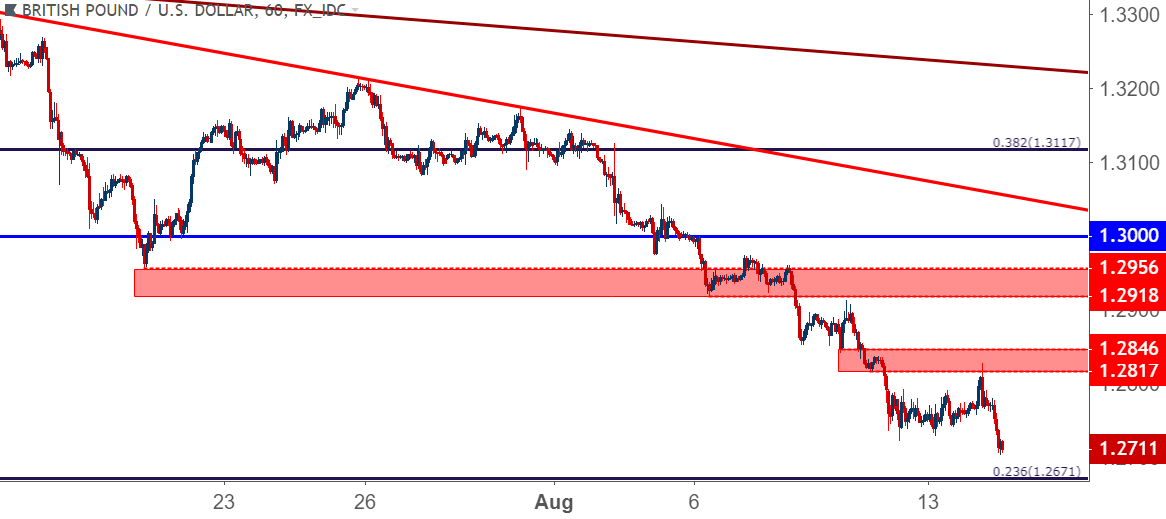
Chart prepared by James Stanley
USD/JPY Trying to Build Support
We’ve been following USD/JPY so far in Q3 as the quarter started out in a very bullish way, with the pair breaking out and running up to fresh six-month highs in fairly short-order. But, more recently, that trend has come into question as denoted by a bearish trend-line that’s been in play for the month of August. The past two days have seen price action break above that trend-line, followed by a support test on the other side. Prices are now pushing up to fresh weekly highs, but we looked at the relevance of the 111.50 level again to denote continuation potential.
USD/JPY Hourly Price Chart

Chart prepared by James Stanley
USD/CAD Bearish Potential on Daily, Bullish on Four-Hour
We looked at two different setups in USD/CAD, both of which are working with the Fibonacci level at 1.3065, which is helping to set support so far today. On the four-hour chart, this can be seen as higher-low support around an area of prior resistance, keeping the door open for bullish continuation.
But – on the Daily chart, we have a potential evening star formation with the past 2.5 days of price action. Today’s candle hasn’t yet closed so that formation isn’t yet confirmed, but if we do see today close at least half-way down the body of Friday’s candle, the evening star is there and this opens the door for bearish setups in the pair.
USD/CAD Daily Price Chart
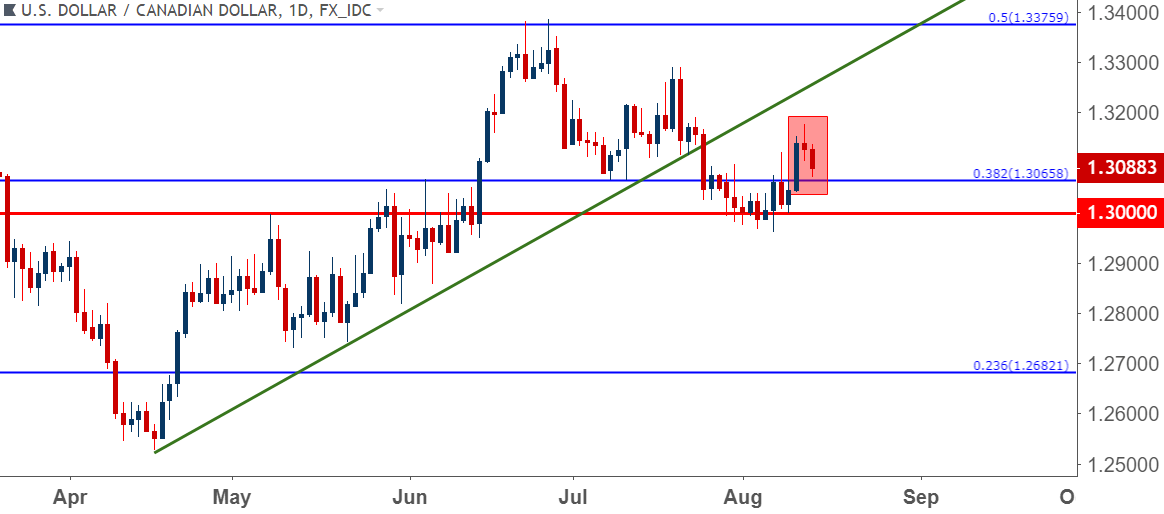
Chart prepared by James Stanley
AUD/USD Breaks Range: Down-Trend Approaching Confluent Support
It’s been a big couple of days for the Australian Dollar as AUD/USD finally broke-out of the range that had been sticking around since June. Prices are now fast approaching an area that had brought two strong reversals in 2015 and 2016 around the .7200 psychological level.
AUD/USD Daily Price Chart
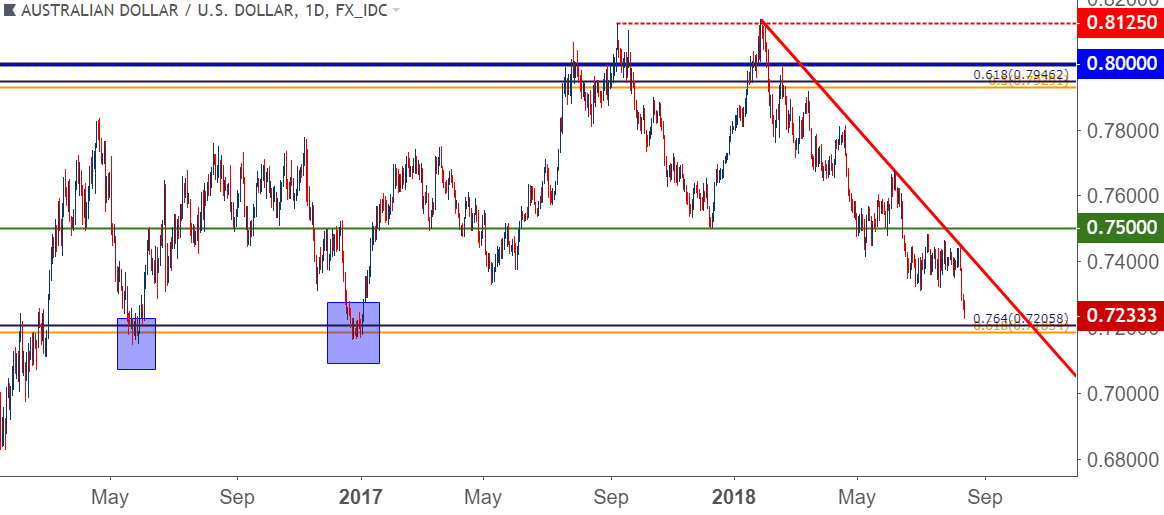
Chart prepared by James Stanley
GBP/JPY Down-Trend Remains Active
This was the other part of our FX Setups of the Week, and so far both resistance levels looked at have come into play along with some relevant reaction.
GBP/JPY Hourly Price Chart
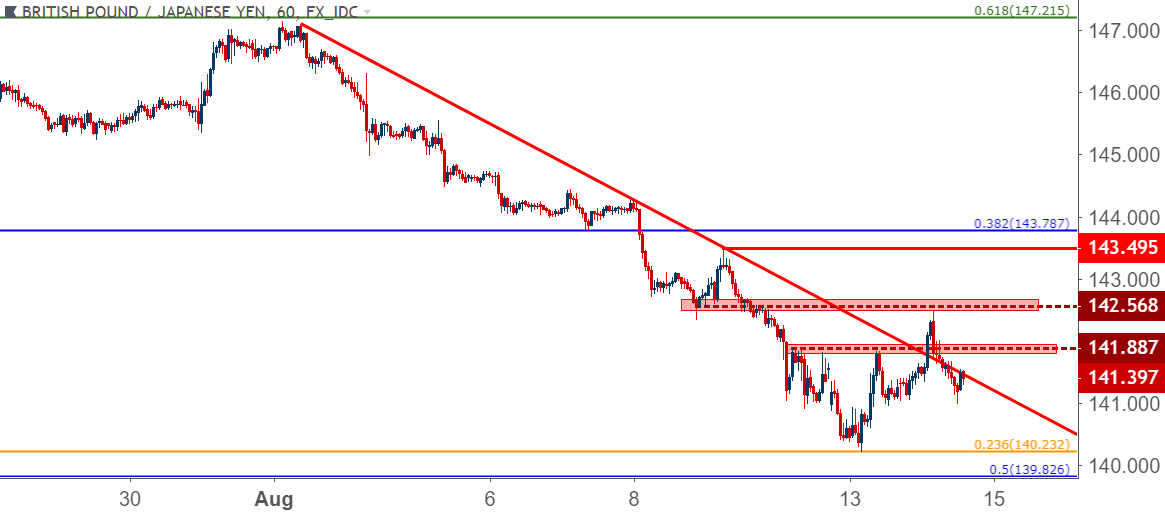
Chart prepared by James Stanley
Dow Jones Testing Support
We closed by looking at US equities through the Dow Jones Industrial Average. Prices have been pulling back over the past week, and at this point we’re seeing a second day of support settle at the ‘s2’ level that we’ve been following.
Dow Jones Four-Hour Price Chart
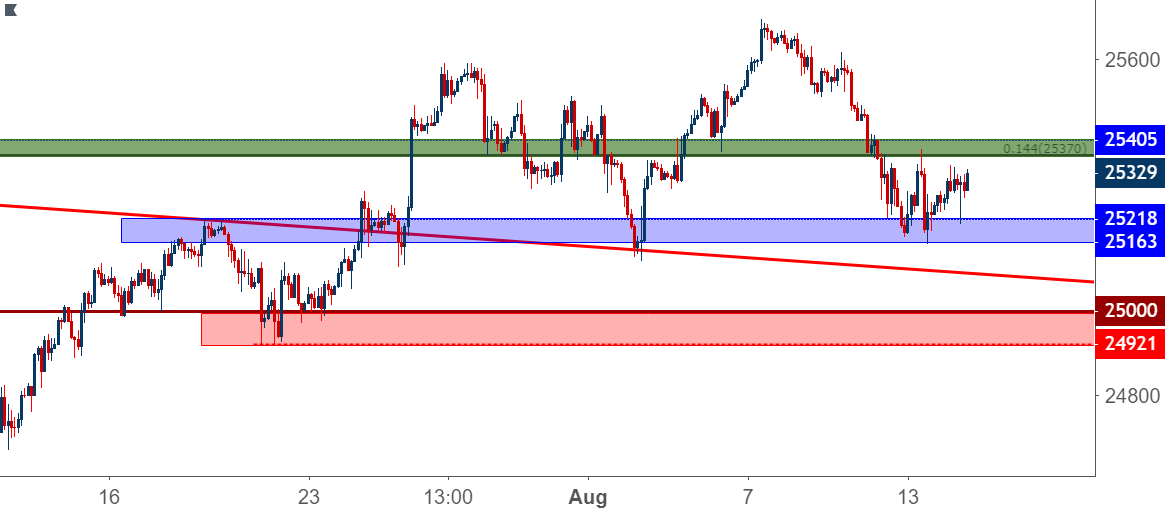
Chart prepared by James Stanley
To read more:
Are you looking for longer-term analysis on the U.S. Dollar? Our DailyFX Forecasts for Q1 have a section for each major currency, and we also offer a plethora of resources on USD-pairs such as EUR/USD, GBP/USD, USD/JPY, AUD/USD. Traders can also stay up with near-term positioning via our IG Client Sentiment Indicator.
Forex Trading Resources
DailyFX offers a plethora of tools, indicators and resources to help traders. For those looking for trading ideas, our IG Client Sentiment shows the positioning of retail traders with actual live trades and positions. Our trading guides bring our DailyFX Quarterly Forecasts and our Top Trading Opportunities; and our real-time news feed has intra-day interactions from the DailyFX team. And if you’re looking for real-time analysis, our DailyFX Webinars offer numerous sessions each week in which you can see how and why we’re looking at what we’re looking at.
If you’re looking for educational information, our New to FX guide is there to help new(er) traders while our Traits of Successful Traders research is built to help sharpen the skill set by focusing on risk and trade management.
--- Written by James Stanley, Strategist for DailyFX.com
Contact and follow James on Twitter: @JStanleyFX


