
Advertisement
Advertisement
AUD/USD Forex Technical Analysis – August 15, 2018 Forecast
By:
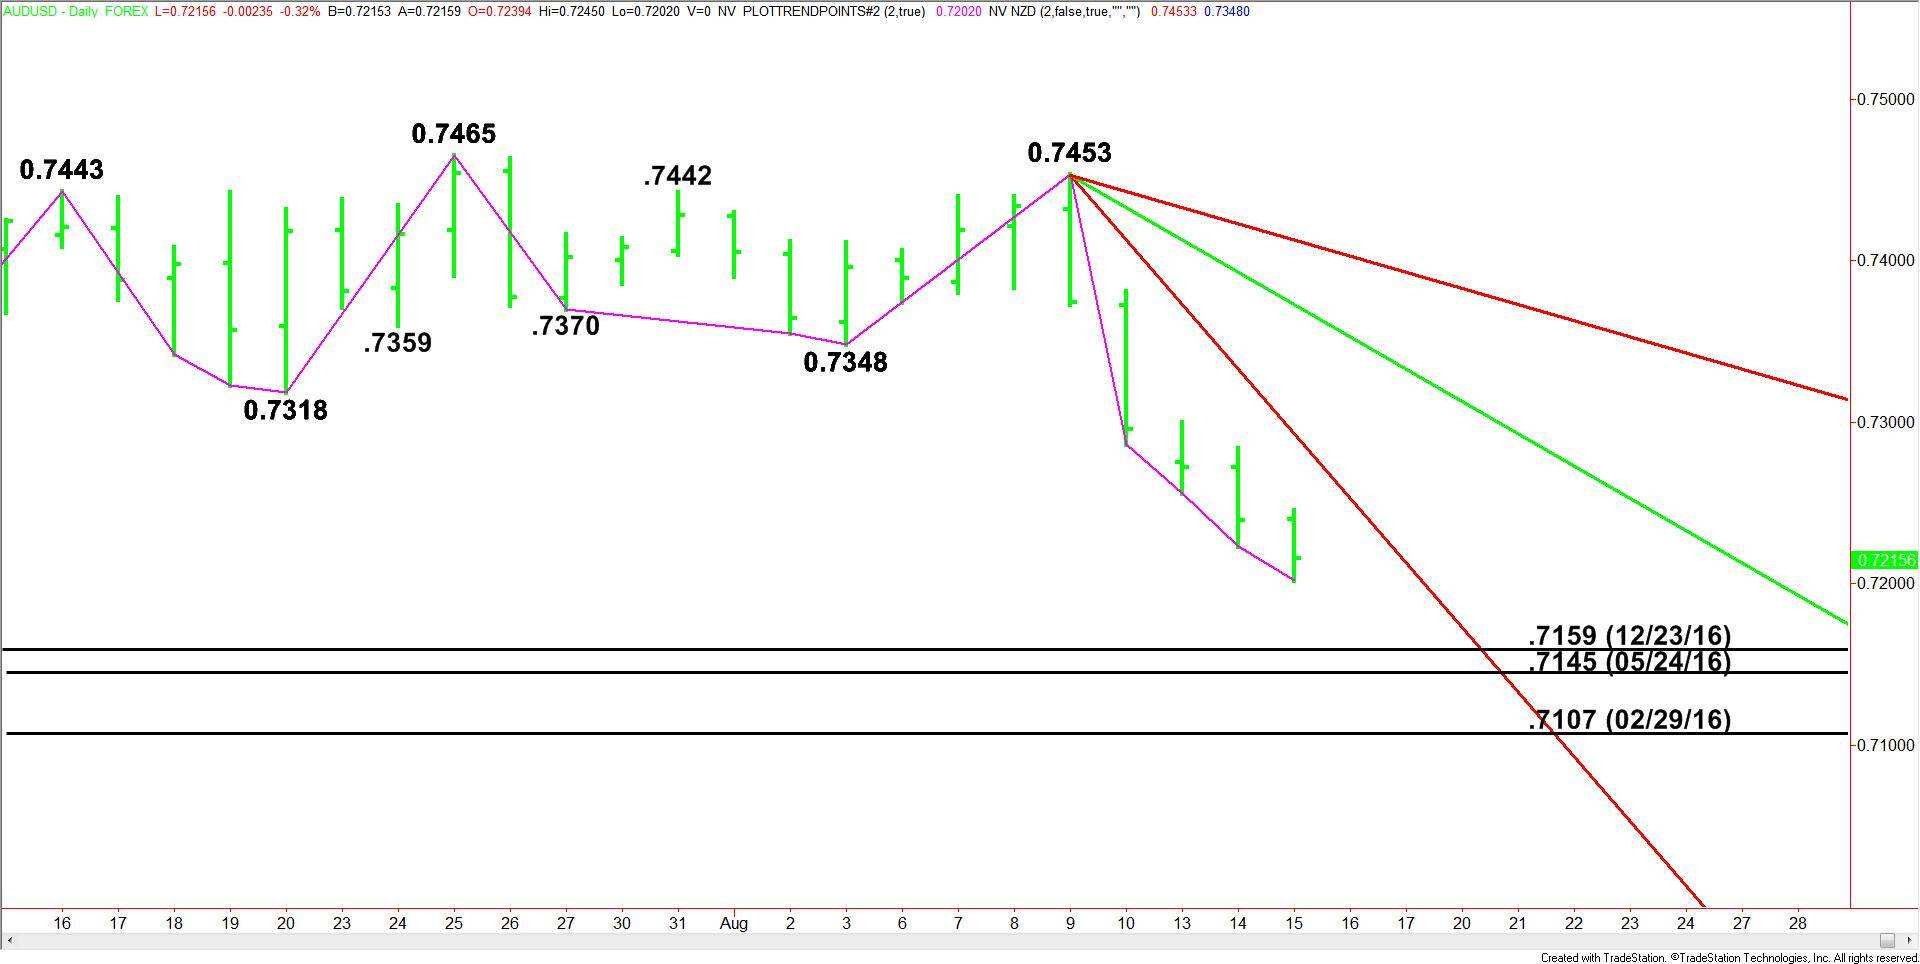
If the selling pressure gains momentum then look for a test of the December 23, 2016 main bottom at .7159, the May 24, 2016 main bottom at .7145 or the February 29, 2016 main bottom at .7107. On the upside, the first level to watch is yesterday’s close at .7239. Recapturing this level and turning higher for the session will put the AUD/USD in a position to post a closing price reversal bottom.

The Australian Dollar is trading lower early Wednesday. Traders are continuing to react to lower demand for risky assets due to the currency turmoil in Turkey. Earlier today, Westpac reported that consumer sentiment fell 2.3% from the previously reported 3.9%. More importantly, the quarterly Wage Price Index came in as expected at 0.6%, up slightly from the previously reported 0.5%.
At 0435 GMT, the AUD/USD is trading .7210, down .0029 or -0.40%.
Daily Technical Analysis
The main trend is down according to the daily swing chart. However, the prolonged move down in terms of price and time has put the Aussie in the window of time for a closing price reversal bottom. The price action is being driven by bearish news at this time. It’s not likely to turn around unless the situation in Turkey improves.
If there is going to be a reversal to the upside then it’s likely to take place following a test of support. The nearest support levels are bunched at .7159, .7145 and .7107.
A closing price reversal bottom will not change the trend to up. All it indicates is that the buying is greater than the selling at current price levels. It also often leads to a 2 to 3 day counter-trend rally, driven mostly by short-covering.
Daily Technical Forecast
If the selling pressure gains momentum then look for a test of the December 23, 2016 main bottom at .7159, the May 24, 2016 main bottom at .7145 or the February 29, 2016 main bottom at .7107.
Start looking for signs of a reversal bottom when the .7159 to .7107 potential support zone is being tested. Even though the trend is down and sentiment bearish, this zone represents value so buyers could start to show up on a test of this area.
On the upside, the first level to watch is yesterday’s close at .7239. Recapturing this level and turning higher for the session will put the AUD/USD in a position to post a closing price reversal bottom.
Intraday, the Aussie could pick up momentum over .7239. In this case, look for the rally to possibly extend into the steep downtrending Gann angle at .7293. This angle has been guiding the AUD/USD lower since August 9. Since the trend is down, sellers are likely to come in on the first test of this angle.
About the Author
James Hyerczykauthor
James is a Florida-based technical analyst, market researcher, educator and trader with 35+ years of experience. He is an expert in the area of patterns, price and time analysis as it applies to futures, Forex, and stocks.
Did you find this article useful?
Latest news and analysis


Advertisement