- USD/JPY bulls are extending the bull trend by keeping the market above the 112.50 resistance.
- USD/JPY is trading above its 50, 100 and 200-period simple moving averages (SMA) which are rising and widening confirming the bullish bias. The market is also trading above the bull trendline. If bulls are able to keep the market above 112.50 the next objective is 113.18, July high.
- However failure to break above 113.18 can lead to a rotation down towards 112.00 figure
USD/JPY 4-hour chart
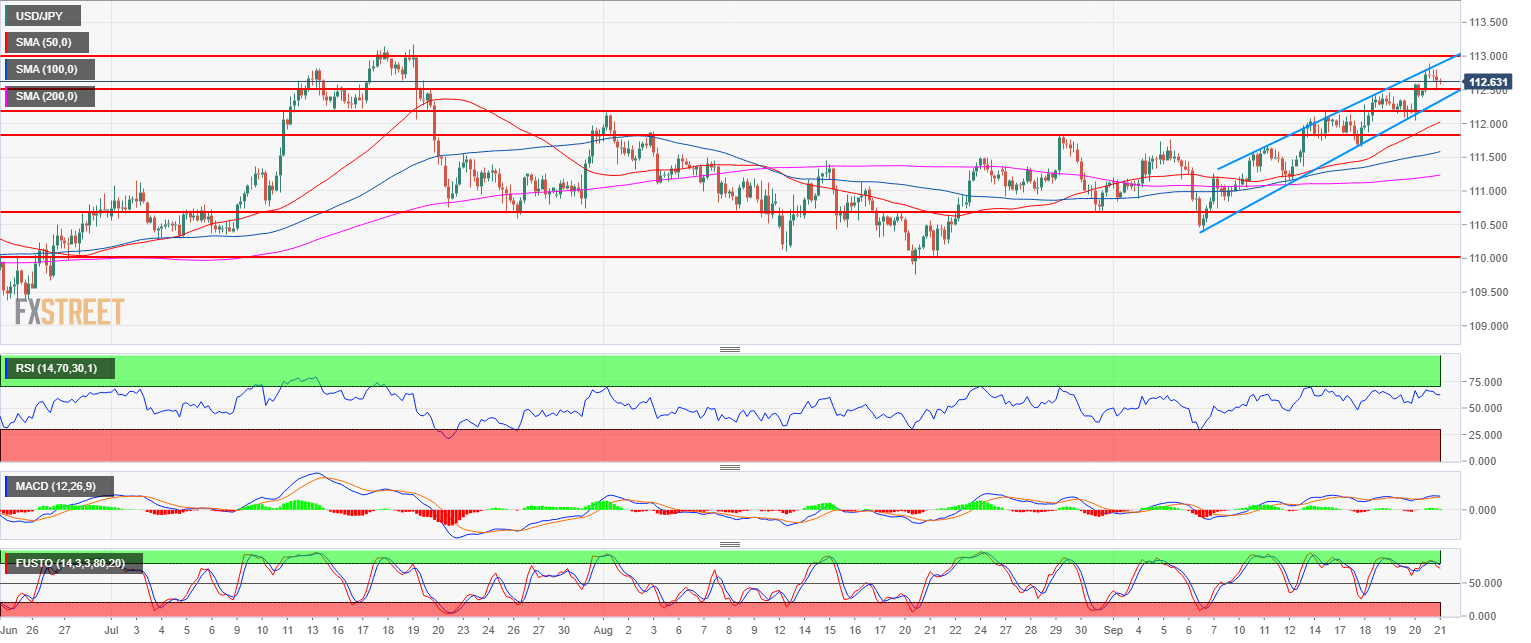
Spot rate: 112.58
Relative change: 0.09%
High: 112.87
Low: 112.42
Main trend: Bullish
Resistance 1: 113.18, July high
Resistance 2: 114.00 figure
Resistance 3: 114.80 November 2017 high
Support 1: 112.50 figure
Support 2: 112.00-112.17 zone, figure and August 1, swing high
Support 3: 111.84 August 29 swing high
Support 4: 111.84 August 29 swing high
Support 5: 111.54 August 6, high
Support 6: 111.45 August 8 high
Support 7: 111.00 figure
Support 8: 110.75, July 23 swing low
Support 9: 110.00 figure
Support 10: 109.37 June 25 low
Note: All information on this page is subject to change. The use of this website constitutes acceptance of our user agreement. Please read our privacy policy and legal disclaimer. Opinions expressed at FXstreet.com are those of the individual authors and do not necessarily represent the opinion of FXstreet.com or its management. Risk Disclosure: Trading foreign exchange on margin carries a high level of risk, and may not be suitable for all investors. The high degree of leverage can work against you as well as for you. Before deciding to invest in foreign exchange you should carefully consider your investment objectives, level of experience, and risk appetite. The possibility exists that you could sustain a loss of some or all of your initial investment and therefore you should not invest money that you cannot afford to lose. You should be aware of all the risks associated with foreign exchange trading, and seek advice from an independent financial advisor if you have any doubts.
Recommended content
Editors’ Picks
AUD/USD could extend the recovery to 0.6500 and above

The enhanced risk appetite and the weakening of the Greenback enabled AUD/USD to build on the promising start to the week and trade closer to the key barrier at 0.6500 the figure ahead of key inflation figures in Australia.
EUR/USD now refocuses on the 200-day SMA

EUR/USD extended its positive momentum and rose above the 1.0700 yardstick, driven by the intense PMI-led retracement in the US Dollar as well as a prevailing risk-friendly environment in the FX universe.
Gold struggles around $2,325 despite broad US Dollar’s weakness

Gold reversed its direction and rose to the $2,320 area, erasing a large portion of its daily losses in the process. The benchmark 10-year US Treasury bond yield stays in the red below 4.6% following the weak US PMI data and supports XAU/USD.
Bitcoin price makes run for previous cycle highs as Morgan Stanley pushes BTC ETF exposure

Bitcoin (BTC) price strength continues to grow, three days after the fourth halving. Optimism continues to abound in the market as Bitcoiners envision a reclamation of previous cycle highs.
US versus the Eurozone: Inflation divergence causes monetary desynchronization

Historically there is a very close correlation between changes in US Treasury yields and German Bund yields. This is relevant at the current juncture, considering that the recent hawkish twist in the tone of the Federal Reserve might continue to push US long-term interest rates higher and put upward pressure on bond yields in the Eurozone.