


Equities Talking Points:
- S&P 500 and Dow Bullish Technical Outlook Forges On.
- EUR/USD Back to Key Resistance as the Nikkei Breaks Out Ahead of BoJ.
- Are you looking for longer-term analysis of Equity prices? Check out our Quarterly Forecasts as part of the DailyFX Trading Guides.
Risk-On Shows in Global Equities in a Big Way as Q3 End Nears
It’s been a strong week across global equities as a number of international bourses have posted brisk topside moves. The previously bearish backdrops that had begun to show around European stocks are now in question as strong recoveries have been seen in both the DAX and the FTSE. Meanwhile, US stocks have continued their upward-ascent as both the Dow and the S&P 500 have pushed to even higher all-time-highs. And the bullish breakout in the Nikkei has drawn into another week, and buyers have continued to push the bid to the point where we’re now nearing fresh 27-year highs in the index.
Below, we go through each of these indices along with the associated technical backdrop.
S&P 500 Starts the Week at Support, Rallies Up to Fresh Highs
Coming into this week, we looked for higher-low support off of a bullish trend-line in the S&P 500, and that filled-in fairly quickly with Monday and Tuesday’s price action. After support came into play from the 2883 area, bulls remained in control as prices continued to push higher, and we’re now trading at fresh all-time-highs.
This simplifies and complicates the setup at the same time: The simplicity is generated from the directional push, as bullish strategies will likely be favored until something materially changes. The matter of complication arises from current levels, as we have a minimum of historical price action around current levels, thereby making support identification a bit more of a projection than would be typically preferred.
Traders can look to work with higher-low support at the prior swing-high around 2915. That can be extended down to the prior swing-low of 2900 to create a support zone, and a test there opens the door for stops to be placed below this week’s swing low, taking place around 2877.
Technical Forecast for the S&P 500: Bullish
S&P 500 Four-Hour Price Chart: Higher-Low Support Potential Around Prior All-Time-High

Chart prepared by James Stanley
Dow Jones Jumps to All-Time-Highs
While the S&P 500 has been working with all-time-highs for about a month already , the Dow just rallied up to its own previous ATH earlier this week. The backdrop, however, is a bit different than what we looked at above, as there is yet to be much for extension beyond this prior high, and that makes the prospect of continuation from current levels a bit more of a challenge. It appears as though a deeper pullback may be in order before the bid-side of this setup might be ready for top-side strategies, and we look at two potential areas below, outlined with blue boxes on the below chart.
Technical Forecast for the Dow Jones: Bullish
Dow Jones Hourly Price Chart: Holding Support at Prior All-Time Highs, Deeper Support Preferred

Chart prepared by James Stanley
DAX Snaps Back After Troubling Start to September
We looked at bearish setups in the DAX coming into the month, largely driven by the breech of a confluent support level on the chart. That theme ran with prominence in the first week-and-a-half of September, but after setting a low ten days ago, prices have been in the process of snapping back. At this stage, we have a bit of resistance showing at a level of interest, taken from the 23.6% Fibonacci retracement of the 2016-2018 major move. If we do see a hold of this resistance next week, the door could remain open to bearish strategies, but given the pace of strength that was seen this week, that could be a challenging prospect.
The forecast for the DAX will be set to neutral for next week; and if we do see sellers show a concerted response to this resistance, that forecast can soon change back to bearish.
Technical Forecast for the DAX: Neutral
DAX Daily Price Chart: Resistance at 23.6% Fibonacci Retracement of 2016-2018 Major Move
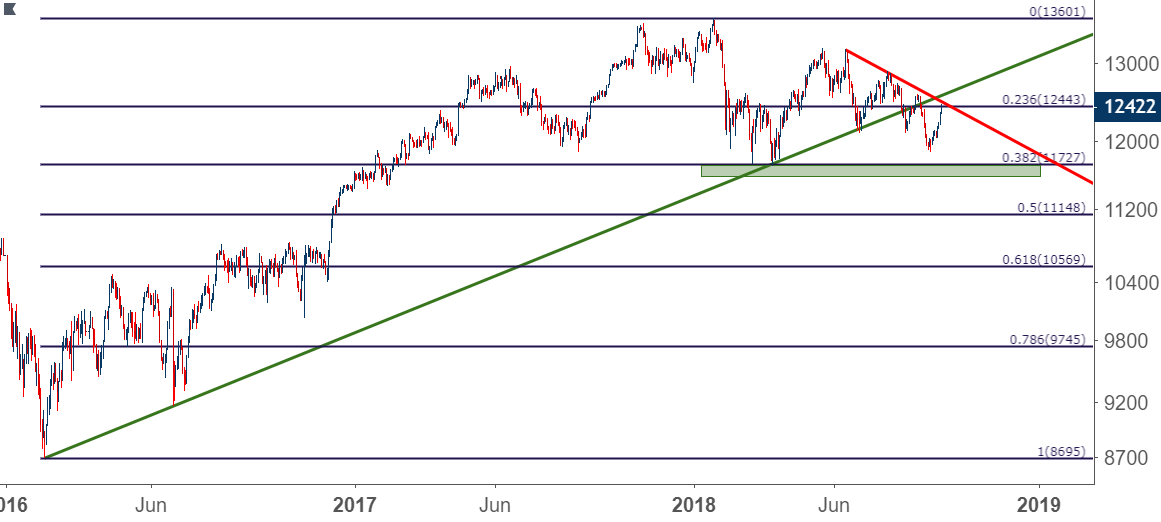
Chart prepared by James Stanley
FTSE 1000 Snaps Back From Key Support
Similarly, we looked at bearish setups in the FTSE coming into September, and this was served-well through the first portion of the month as sellers grasped control and continued to drive. But just as we saw with the DAX, a bit of support began to develop mid-month that quelled the declines until, eventually, buyers could start to lift prices again.
The bullish response in the FTSE, however, was a bit slower to come to life and a bit later to the party than what we saw in the DAX, and it really appeared as though there was somewhat of a counter-active response to Brexit proceedings. Earlier in the month, as the Pound remained strong, the FTSE showed weakness, breaking through multiple support levels in the process. But, as Brexit tensions began to re-show over the past two days, FTSE bulls have come back to life and prices have jumped-higher.
We’re now testing the 38.2% Fibonacci retracement of the March-May bullish move in the index, and this is confluent with the 50% marker of the August-September sell-off. And while this is an interesting level of resistance, the pace of this week’s incline should not be easily discounted; and this adds question to the prospect of bearish continuation. The forecast will similarly be held at neutral for this week, and this could be moved to bullish if we do see re-engagement above confluent resistance around 7500; while bearish strategies can come back to light if we see sellers push back-below 7378, or the 50% marker of that March-May bullish move.
FTSE 100 Eight-Hour Price Chart: Resistance at Fibonacci Confluence, Prior Swing Support
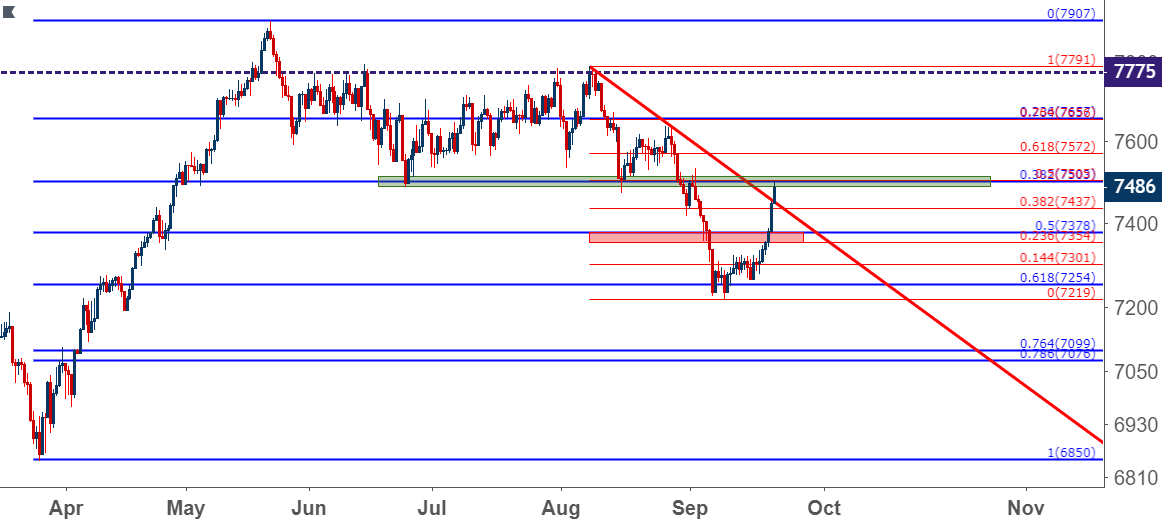
Chart prepared by James Stanley
Nikkei Breakout Continues to Run
We’ve also been following a brewing breakout in the Nikkei throughout the month of September. Coming into the period, we pointed out an ascending triangle formation while initiating a bullish bias on the index. Such a pattern will normally be approached in a bullish manner, looking for the motivation that’s continued to drive bulls in at higher lows to eventually take-out and eclipse the horizontal level of support that’s held the advance.
That horizontal resistance comes from a really interesting level on the chart, as this is the 50% marker of the 28-year move in the Nikkei.
Nikkei Monthly Price Chart: Bullish Breakout Beyond a Big Long-Term Level
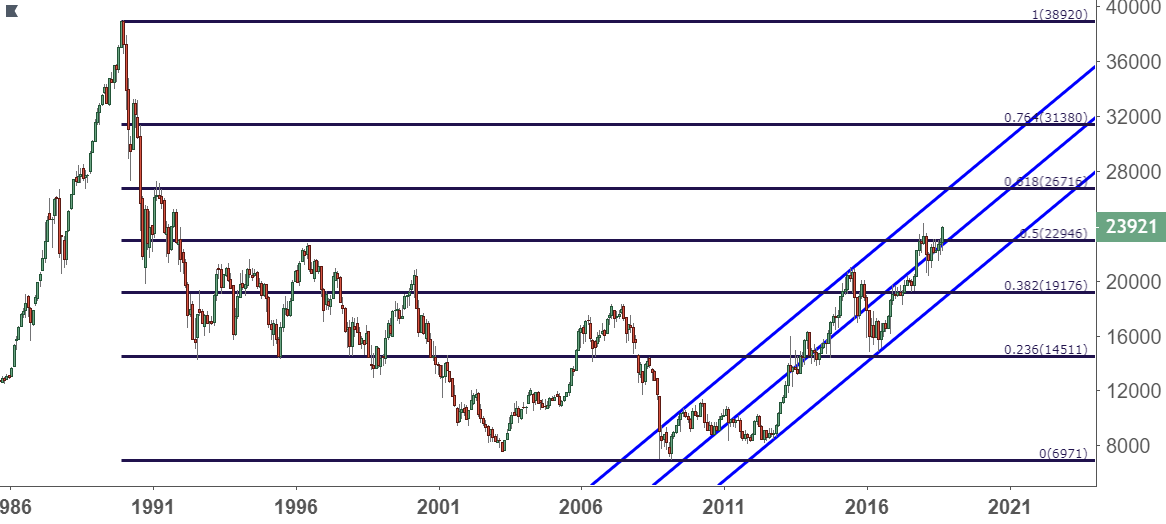
Chart prepared by James Stanley
As we now near the 27-year high in the Nikkei, which was previously established in January, the big question is just how motivated buyers may remain to be. Looking at short-term charts, the strength so far has been pronounced as bulls have yet to allow for much of a pullback. Below, we incorporate two possible zones of interest for higher-low support, both of which are taken from prior price action swings, and each of these could keep the prospect of bullish continuation as attractive.
The forecast on the Nikkei will remain at bullish.
Nikkei Daily Price Chart: Bullish Breakout Eyes 27-Year High
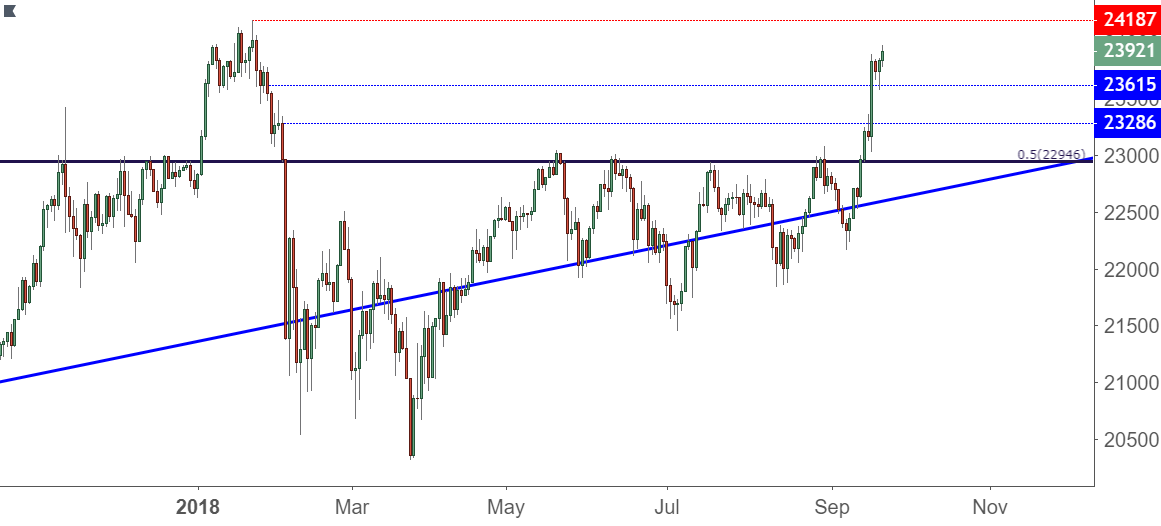
Chart prepared by James Stanley
To read more:
Are you looking for longer-term analysis on the U.S. Dollar? Our DailyFX Forecasts for Q1 have a section for each major currency, and we also offer a plethora of resources on USD-pairs such as EUR/USD, GBP/USD, USD/JPY, AUD/USD. Traders can also stay up with near-term positioning via our IG Client Sentiment Indicator.
Forex Trading Resources
DailyFX offers a plethora of tools, indicators and resources to help traders. For those looking for trading ideas, our IG Client Sentiment shows the positioning of retail traders with actual live trades and positions. Our trading guides bring our DailyFX Quarterly Forecasts and our Top Trading Opportunities; and our real-time news feed has intra-day interactions from the DailyFX team. And if you’re looking for real-time analysis, our DailyFX Webinars offer numerous sessions each week in which you can see how and why we’re looking at what we’re looking at.
If you’re looking for educational information, our New to FX guide is there to help new(er) traders while our Traits of Successful Traders research is built to help sharpen the skill set by focusing on risk and trade management.
--- Written by James Stanley, Strategist for DailyFX.com
Contact and follow James on Twitter: @JStanleyFX
Other Weekly Technical Forecast:
Australian Dollar Forecast: AUD/USD Eyes Key February Trend Line as EUR/AUD Prolongs Reversal
Euro Forecast: Looking for Euro Breakout to Hold
US Dollar Forecast: Dollar Triggers a Technical Breakdown, Will Bears Show Up?


