
Advertisement
Advertisement
AUD/USD Forex Technical Analysis – Facing Series of Retracement Zone Resistance Levels
By:
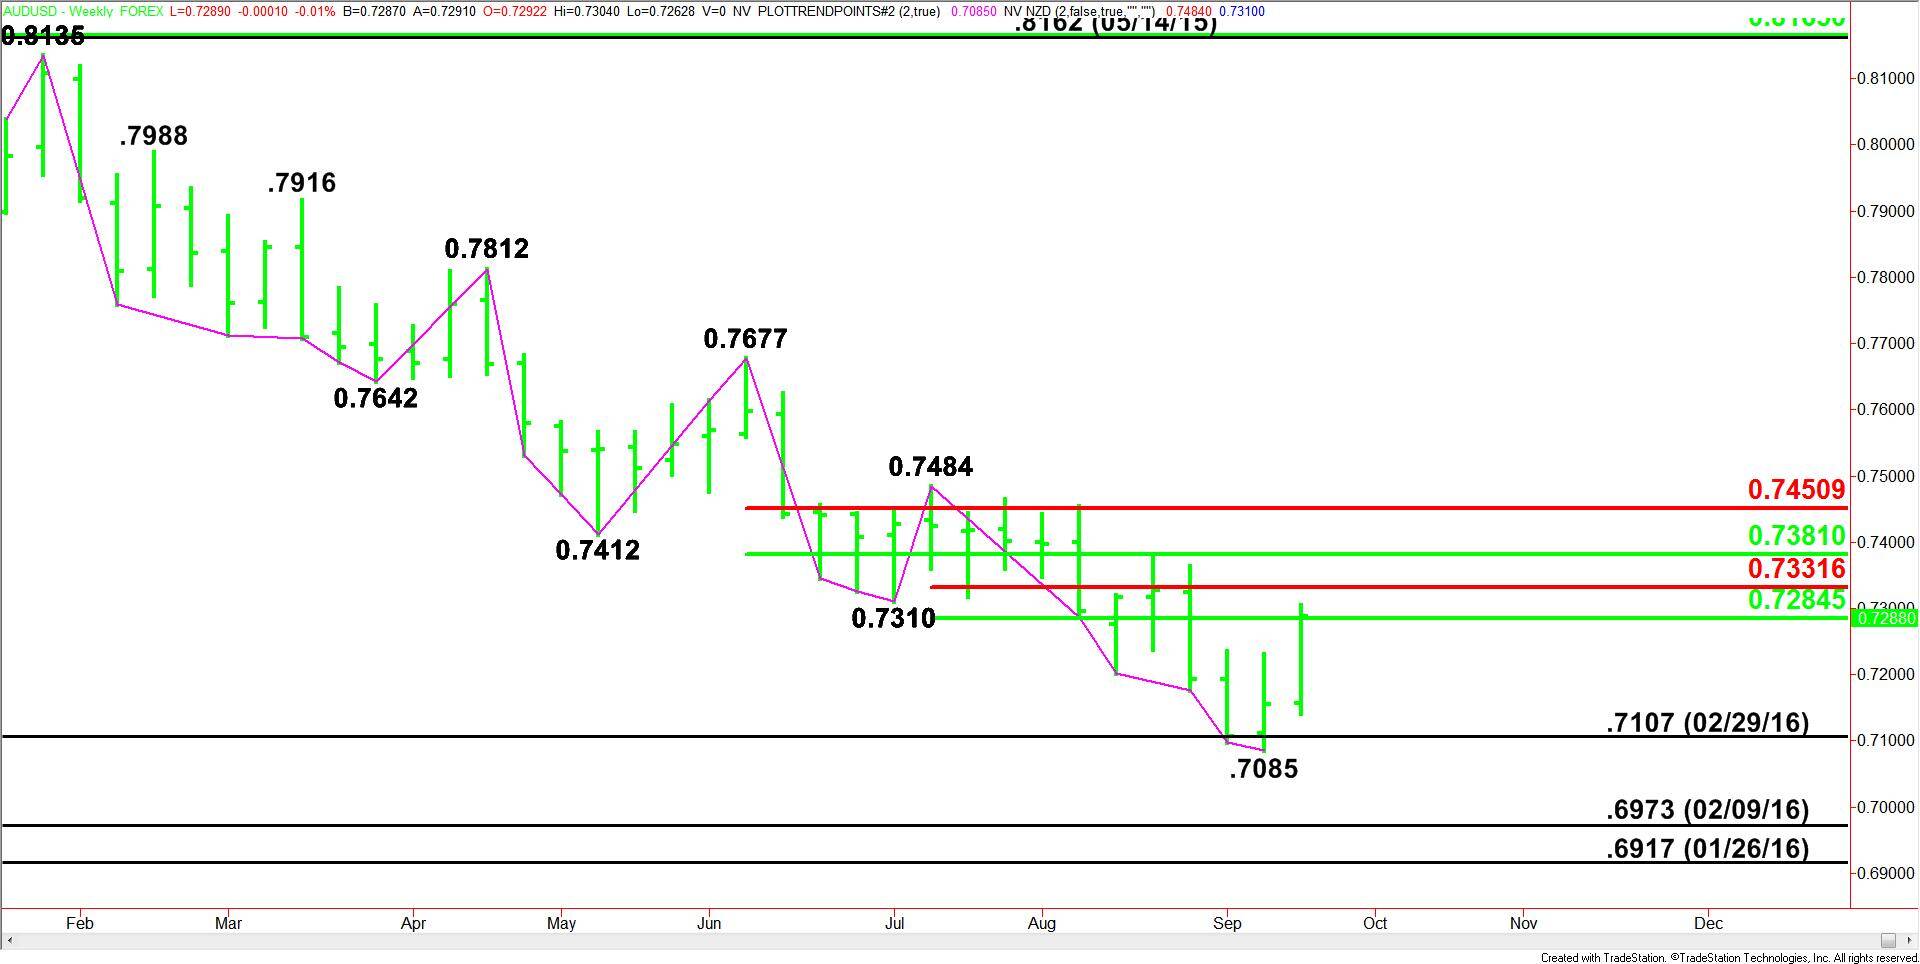
Based on last week’s price action and the close at .7288, the direction of the AUD/USD this week is likely to be determined by trader reaction to the short-term 50% level at .7284.
The Australian Dollar settled higher last week in what was essentially a follow-through move fueled by the closing price reversal bottom from the week-ending September 14. The rally looks impressive on the daily chart, but on the weekly chart, it is basically a retracement of a short-term range.
Typically, the reversal chart pattern triggers a 2 to 3 week counter-trend rally. The rally is usually 50% to 61.8% of the current range. The Forex pair already hit this objective so the counter-trend rally may be over. If not, it’s going to be a grind because of additional retracement levels overhead.
For the week, the AUD/USD finished at .7288, up 0.0133 or +1.86%.
Weekly Swing Chart Technical Analysis
The main trend is down according to the weekly swing chart. However, momentum shifted to the upside following a closing price reversal bottom and the subsequent confirmation of the chart pattern last week.
A trade through .7085 will negate the reversal chart pattern and signal a resumption of the downtrend. The main trend will change to up on a trade through .7484.
The short-term range is .7484 to .7085. Its retracement zone at .7285 to .7332 is the first upside target. This zone was tested last week.
The intermediate range is .7677 to .7085. Its retracement zone at .7381 to .7451 is the next potential upside target.
Weekly Swing Chart Technical Forecast
Based on last week’s price action and the close at .7288, the direction of the AUD/USD this week is likely to be determined by trader reaction to the short-term 50% level at .7284.
A sustained move over .7284 will indicate the presence of buyers. If this move attracts enough buyers then look for the rally to extend into the short-term Fibonacci level at .7332.
Overtaking .7332 will indicate the buying is getting stronger with the next target zone .7381 to .7381.
A sustained move under .7484 will signal the presence of sellers. The first downside target is 50% of the first leg up from the reversal bottom. This level is .7195. If it fails then look for the selling pressure to increase with .7085 the next target.
About the Author
James Hyerczykauthor
James is a Florida-based technical analyst, market researcher, educator and trader with 35+ years of experience. He is an expert in the area of patterns, price and time analysis as it applies to futures, Forex, and stocks.
Did you find this article useful?
Latest news and analysis


Advertisement