


US Dollar tests recent lows just below 94, but cannot punch through with force. The Elliott Wave counts are mixed so be mindful of a rally.
The video above is a recording of a US Opening Bell webinar from September 24, 2018. We focused on the Elliott Wave and patterns for Dollar Index, EURUSD, NZDUSD, Gold, and Silver. The patterns may subdivide into complex corrections though we are anticipating another round of round of dollar weakness over the medium term.
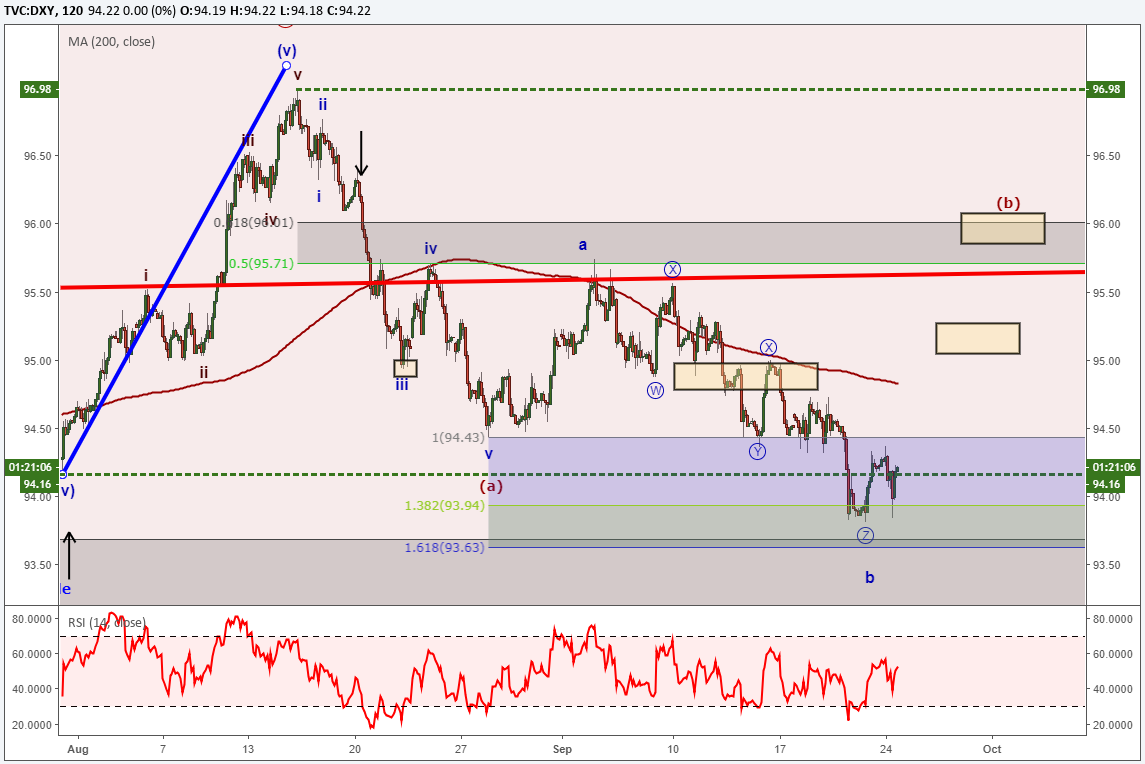
Dollar Index Tests 3 Week Low
US Dollar Index keeps probing its recent lows. The jury is still out as to whether this is circle wave ‘c’ lower or a complex circle wave ‘b’ that will shoot higher to finalize. With DXY yet to meaningfully break 93.63, we need to respect the potential for circle wave ‘b’ to continue higher and retest 95.25 and possibly 96. Otherwise, a meaningful break below 93.63 opens the door to 93.26 and possibly 91.72.
The bearish view is valid so long as dollar index holds below 96.98.
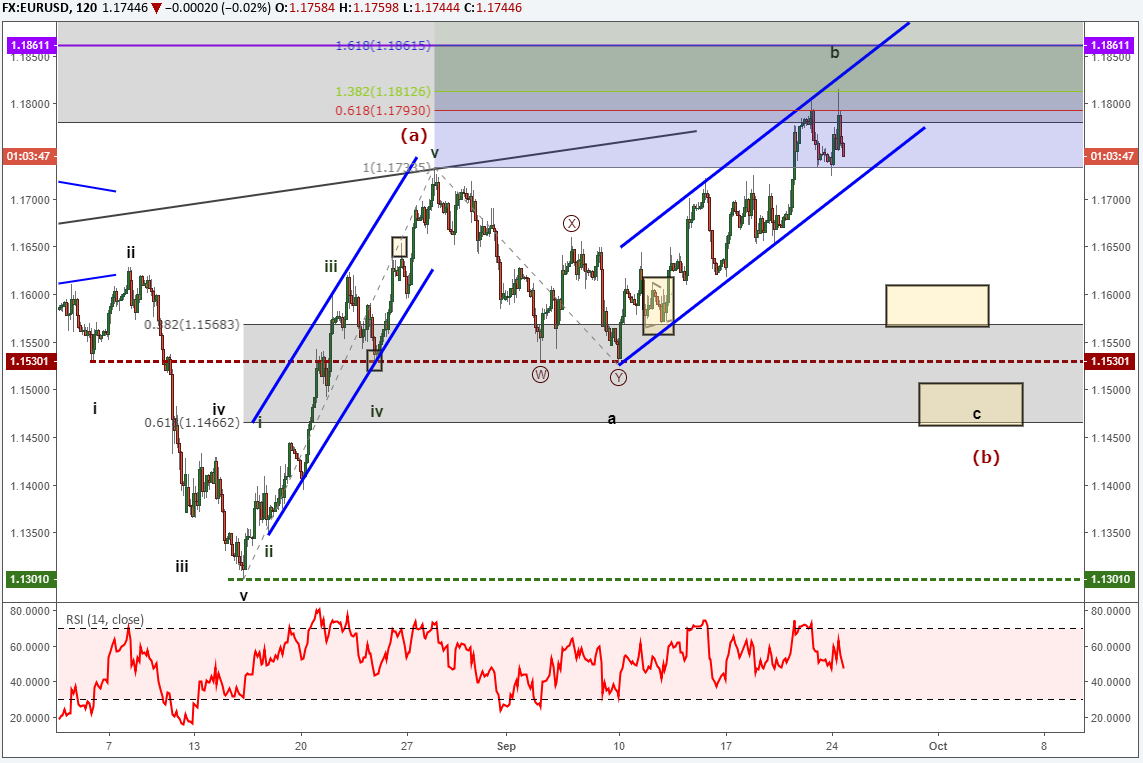
EURUSD Elliott Wave Chart Points to Multi-Month rally
The EURUSD chart is the opposite of DXY. The upper key level is 1.1862. Until a meaningful break of this level occurs, we are considering the move higher as a ‘b’ wave. This suggests a correction lower in a ‘c’ wave to 1.1550 and possibly 1.1450.
Since August 20, we have been anticipating a multi-month rally in EURUSD as the Elliott Wave from February 2018 concludes. If EURUSD does drop to 1.1550, then we will be looking for bullish symptoms as an ensuring rally may drive it above 1.18 towards 1.20-1.22.
Sentiment has certainly fed a movement higher in EURUSD as traders dropped from being 41% long to 37% long earlier today. This is not a meaningful move either way to offer clarity to the patterns.
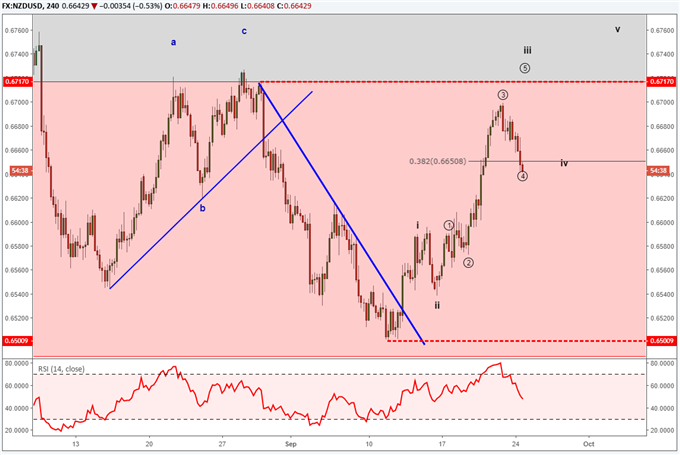
NZDUSD Kicks off rally with Elliott Wave impulse
The Elliott Wave picture for NZDUSD shows a strong potential for a developing impulse wave. Kiwi may be going through a wave 4 correction now. So long as prices hold above .6580, then a bullish bias is warranted to finalize the bullish impulse.
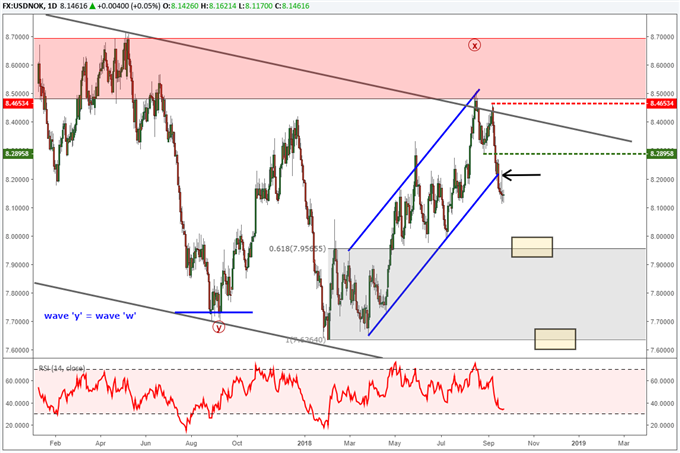
Norwegian Krone Finds Strength in Central Bank Meeting
USDNOK and EURNOK charts sport bearish patterns as Norwegian Krone has been strengthening for the past couple of weeks. Prior to the Norges Bank meeting last Thursday, we closed out half of both short EURNOK and short USDNOK to remove risk from the market. USDNOK went through a brief rally but has returned towards lower levels. For the moment, we are hanging on to the remainder of both EURNOK and USDNOK short. We are targeting 7.96 and possibly 7.63 for USDNOK.
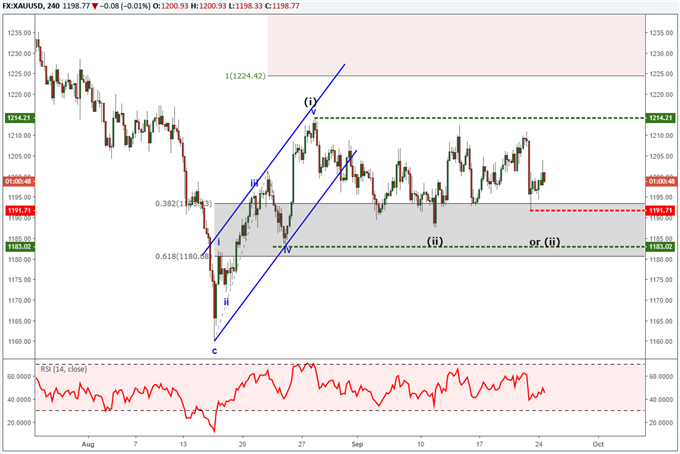
Gold price chart holds above August low
On August 30, we forecasted a shiny future for gold. Gold’s price chart has advanced in an impulsive wave and is now correcting sideways. This sideways correction likely holds above the August 15 low of 1160. We are unsure of the corrective wave that is unfolding, but so long as gold prices remain above 1160, the pattern is bullish.
Silver prices punch new lows
Meanwhile, silver prices continue to be weak and trade near two-year lows. We are counting the sell-off as a ‘Y’ wave of a complex W-X-Y downward correction.
The divergent behavior between gold and silver where silver pounds new lows and gold holds above often occurs near important turns. Therefore, this behavior is symptomatic of a price reversal looming nearby.
The gold-silver ratio at 23 year extreme
This divergent price action between gold and silver has driven the gold-silver ratio to its highest level since 1995. These are lofty levels and it can continue to move higher. However, the divergent price action warns the metals may trend higher. Couple that with an extremely high gold-silver ratio and I anticipate silver may catch up and outperform on a bullish move.
Elliott Wave Theory FAQ
How does Elliott Wave theory work?
Elliott Wave theory is a trading study that identifies the highs and lows of price movements on charts via wave patterns. Traders analyze the waves for 5-wave moves and 3-wave corrections to determine where the market is at within the larger pattern. Additionally, the theory maintains three rules and several guidelines on the depth of the waves related to one another. Therefore, it is common to use Fibonacci with Elliott Wave analysis. We cover these topics in our beginners and advanced Elliott Wave trading guides.
After reviewing the guides above, be sure to follow future Elliott Wave articles to see Elliott Wave Theory in action.
---Written by Jeremy Wagner, CEWA-M
Jeremy Wagner is a Certified Elliott Wave Analyst with a Master’s designation. Jeremy provides Elliott Wave analysis on key markets as well as Elliott Wave educational resources. Read more of Jeremy’s Elliott Wave reports via his bio page.
Communicate with Jeremy and have your shout below by posting in the comments area. Feel free to include your Elliott Wave count as well.
Discuss these markets with Jeremy in Monday’s US Opening Bell webinar.
Follow me on Twitter at @JWagnerFXTrader .


