


Cryptocurrency Prices, News and Technical Analysis
- Bitcoin (BTC) remains dominant, but chart shows little upward momentum.
- Ripple’s (XRP) recent rally may help build positive sentiment.
Ripple (XRP) and Litecoin (LTC) Charts - A Positive Light in a Gloomy Market?
The cryptocurrency market remains in a bear grip as a space but a couple of the larger tokens are showing signs of a rebound, if certain parameters are met.
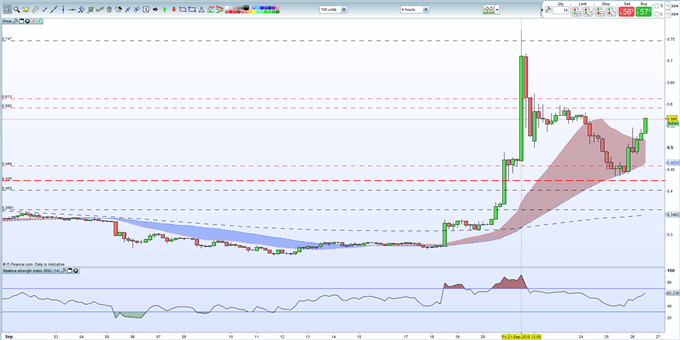
Ripple’s recent surge has seen it break and close above the important support zone between $0.35 and $0.42 which remains key support if XRP is to push higher. Ripple is also trading above all three moving averages, on the four hour chart, and may well re-test the $0.59 to $0.62 level in the short-term. A break and close above here could see the recent $0.77 high regained.
Ripple (XRP) Four Hour Price Chart (September 3 – 26, 2018)
Litecoin (LTC) Stuck in a Cluster of Moving Averages
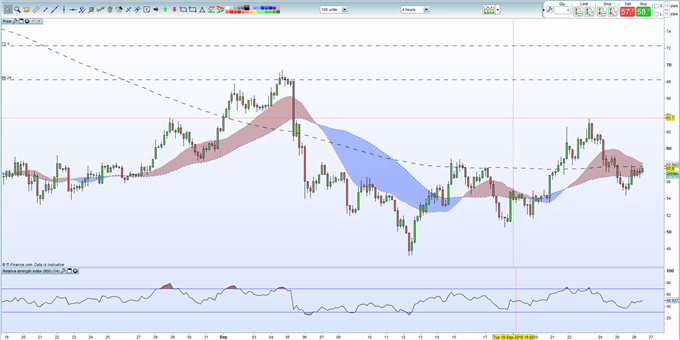
Litecoin’s near-term direction will be dictated shortly as it current trades in a confluence of moving averages. The 20-, 50- and 200-day moving avergae sit between $57 and $58.25 while LTC current changes hands at $57.5. A break and close higher open $64 and $69.
Litecoin (LTC) Four Hour Price Chart (August 18 – September 26, 2018)
We look at Bitcoin, Ethereum, Ripple, Bitcoin Cash and Litecoin at our Weekly Cryptocurrency Webinar every Wednesday.
Cryptocurrency Trader Resources
If you are interested in trading Bitcoin, Bitcoin Cash, Ethereum, Litecoin or Ripple we can help you begin your journey with our Introduction to Bitcoin Trading Guide.
What’s your opinion on the latest chart updates? Share your thoughts and ideas with us using the comments section at the end of the article or you can contact me on Twitter @nickcawley1 or via email at nicholas.cawley@ig.com.
--- Written by Nick Cawley, Analyst.


