


US Dollar Talking Points:
- The US Dollar continues to hold support around the 95.00 level after last week’s bullish move failed after a test of 96.00. Currencies have been relatively calm over the past week as sell-offs enveloped global equities, and Friday/Monday price action has produced a back-and-forth move with respect of the prior Thursday lows. A number of earnings reports will punctuate this week’s data outlay as a relatively quiet macro calendar lays ahead, with the highlight being a series of inflation prints out of the UK, Japan and Canada.
- Global stocks appear to be trying to cauterize support after last week’s rather aggressive drop. This was part of this week’s Technical forecast in equities, in which a bullish forecast was issued on the Dow Jones while a bearish forecast was held from the week-prior in the DAX. As we move deeper into Q4 price action, a number of interesting themes remain around global stocks and the pace of Q3 earnings will likely help to shape that tone.
- DailyFX Forecasts on a variety of currencies such as the US Dollar or the Euro are available from the DailyFX Trading Guides page. If you’re looking to improve your trading approach, check out Traits of Successful Traders. And if you’re looking for an introductory primer to the Forex market, check out our New to FX Guide.
Do you want to see how retail traders are currently trading the US Dollar? Check out our IG Client Sentiment Indicator.
Dollar Dips Below 95.00 While Equities Attempt to Bounce From Support
Last week’s sell-off in global equities continues to loom large as stocks attempt to cauterize support. While Friday helped to hold the lows in many equity indices, Monday’s price action continued to show back-and-forth dynamics and, as of yet, we haven’t seen much for a recovery off of the lows.
Currencies, on the other hand, continue to look relatively calm. The US Dollar is testing through support at the same 95.00 level that we saw last week; EUR/USD is making another push up to short-term resistance around the 1.1600-handle, and bulls continue to show up in GBP/USD as the pair is pushing higher after a gap-down to a key support zone on Sunday.
Perhaps fitting for that tone, Q3 earnings out of the US pick up this week as a number of big names are reporting. This runs in contrast to a macro calendar that’s rather light, with a few high-impact items of note in the coming days. Tomorrow brings UK inflation for the month of September, followed by the release of FOMC meeting minutes later in the afternoon. Japanese inflation is released on Friday morning, and this is followed by Canadian CPI and a speech from BoE Governor, Mark Carney. Outside of that – we’ll likely see considerable focus paid to Q3 earnings releases out of the United States for signs of continued growth in the United States.
DailyFX Economic Calendar: High-Impact Events for the Remainder of This Week

Chart prepared by James Stanley
US Dollar Tests Support Around 95.00
Last Thursday we looked at the US Dollar dropping back to the key level of 95.00, and this is the same price that helped to set swing-support as we closed Q3 and then again shortly after we opened into Q4. Last week had seen a respectable drop in the Dollar after the currency tested above the 96.00 level on Tuesday; but similar to what was seen earlier in the month, support held at 95.00 and sellers are starting to make a bit of ground as prices are dipping down to fresh three-week-lows.
At this stage, bears are tip-toeing below support, and a down-side break opens the door for a move towards prior levels of interest around 94.73, followed by a zone that runs from 94.20-94.36.
US Dollar Daily Price Chart: Support at 95.00 Remains
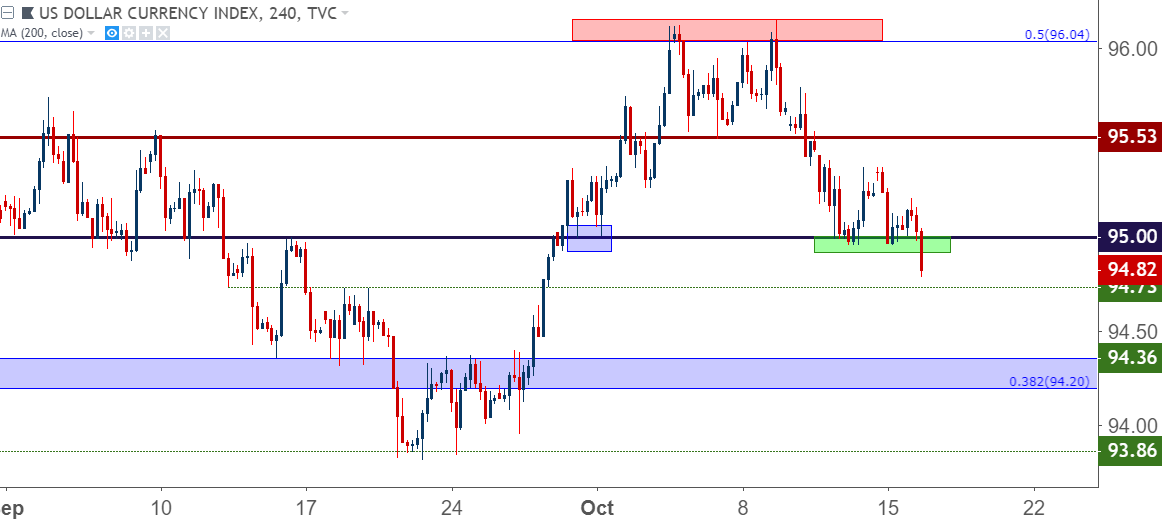
Chart prepared by James Stanley
EUR/USD Buckles Up to Near-Term Resistance
Corresponding with that move back to 95.00 with the short-term tests below, EUR/USD has returned to the zone that helped to produce last week’s resistance. This runs from 1.1590-1.1625, and a break-above exposes the deeper resistance around the Fibonacci level at 1.1709.
EUR/USD Four-Hour Price Chart: Return to Short-Term Resistance
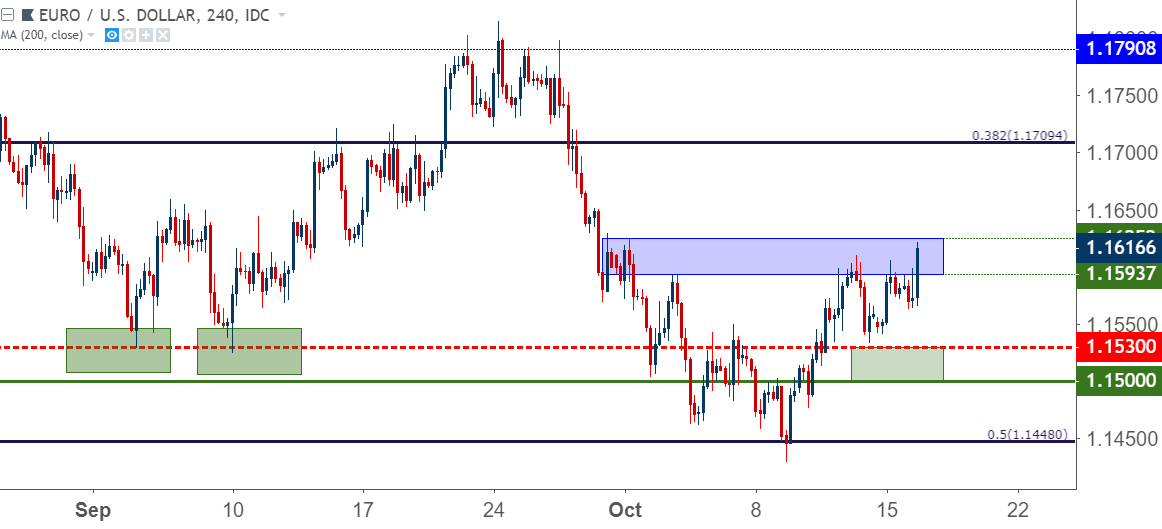
Chart prepared by James Stanley
GBP/USD Gaps-Down to Support, Bounces to Start the Week
Last week brought the potential for bullish strategies in GBP/USD, and this was part of the FX Setups of the Week that was looked at ahead of the weekly open. That strength largely remained intact throughout the period as GBP/USD rose above the 1.3200 psychological level.
But this week’s open produced an aggressive gap-lower to a key area of support, and this comes in around the area that was investigated last Wednesday that runs from 1.3098-1.3117. The weekend gap was promptly filled, and now prices have re-ascended back above the 1.3200-handle. At this stage, the big question is one of continuation potential, and traders can re-incorporate a prior zone of support to look for bullish plays in the pair. This zone runs from prior resistance swings that run from 1.3186-1.3199.
GBP/USD Two-Hour Price Chart: Gap-Down to, Bounce From Key Support Zone

Chart prepared by James Stanley
Dow Attempts to Hold 25k Support
We had looked at this setup in the midst of last week’s equity sell-offs, drawing attention to the prior area of support around the 25,000 level in the Dow Jones. This was the same space that helped to set support in mid-August, just before the index went on to fresh all-time highs as we closed down Q3 and opened Q4. This also intersects with the 200-Day Moving Average, and after a series of tests on Thursday, Friday and then again yesterday, US futures are showing a bounce ahead of the equity open.
The big question at this point is whether it can hold, and this is the motivation for the bullish forecast in the Dow as part of this week’s Technical Forecast.
Dow Jones Daily Price Chart: Hold of Support at Key Zone Around 25k
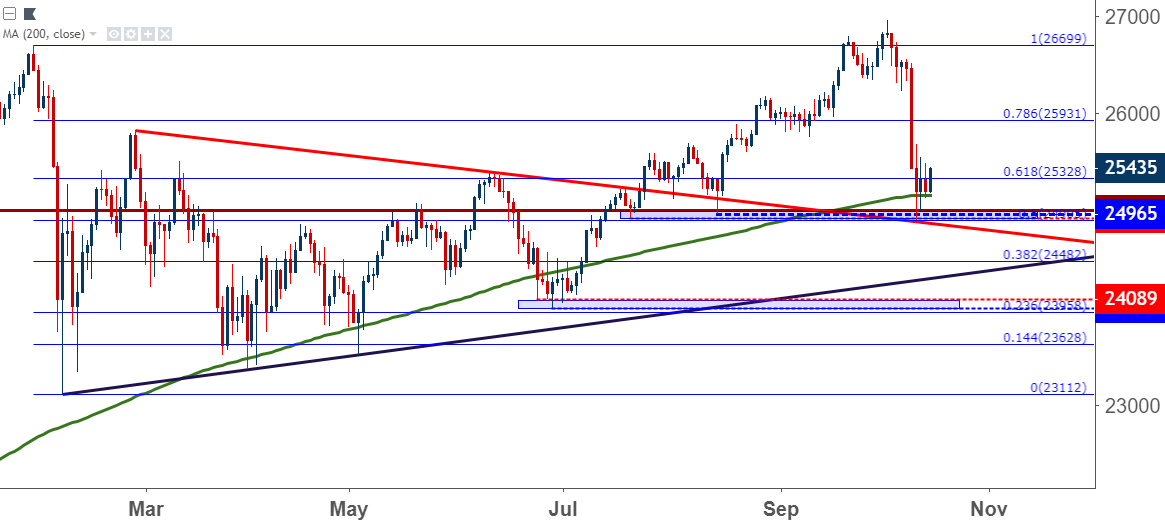
Chart prepared by James Stanley
S&P 500 Holding Resistance at 200 DMA
While a similar feel has shown around the S&P 500, with last week’s declines finding support on Thursday which has held into this morning, there’s a bit less optimism as prices remain below the 200 Day Moving Average. That may not last for long, however, as price action is buckling up to this area for near-term resistance, and given that this has already happened over the previous few trading days, that resistance may not hold for long. The Friday bounce moved right-up to this moving average, and yesterday’s move-lower helped to show a hold at resistance.
On the S&P 500, a break back-above the 2795/2800 level will make the prospect of bullish continuation strategies look considerably more attractive, as there would then be further evidence of bulls re-grasping control after last week’s sell-offs.
S&P 500 Tests Below 200 DMA, Holds as Short-Term Resistance
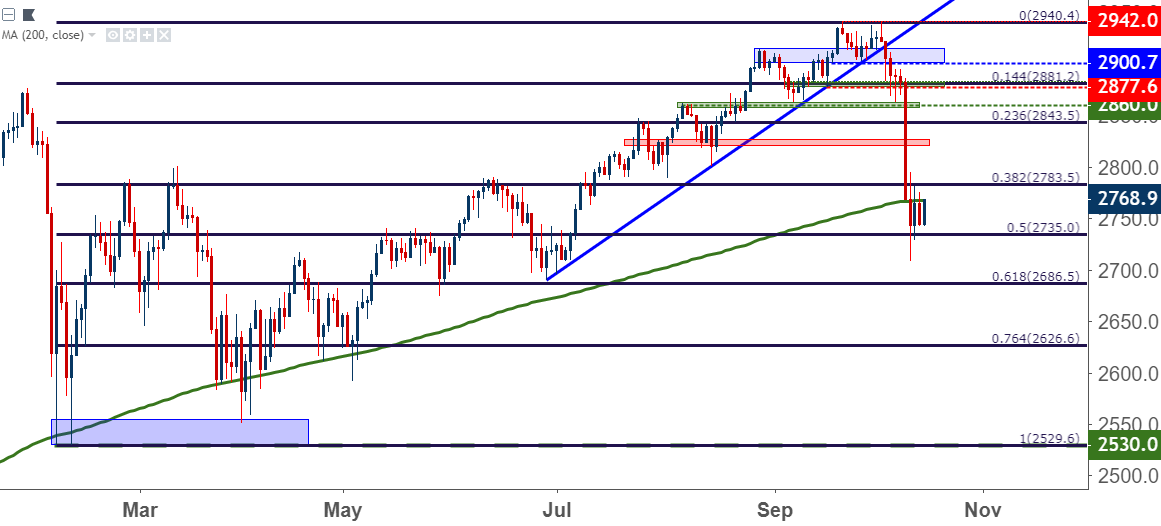
Chart prepared by James Stanley
For Plays on Equity Weakness – Look to the DAX
Last week’s equity sell-offs were fairly pronounced . I had looked at a bearish setup in the DAX coming into the week as prices were coming off of resistance at a big level – and targets appeared set for a return to the March lows, which happened to print around the 38.2% retracement of the 2016-2018 major move in the index.
Those targets were met in quick fashion and prices pushed down to fresh 18-month lows on Wednesday of last week. But since that low, prices have been bouncing, and we’re fast nearing that prior point of support. For those that do want to look at bearish plays in global equities, this setup would remain of interest, as resistance holding at a key area of prior support keeps the door open for down-side continuation plays in the DAX.
DAX Daily Price Chart: Bounce From 18-Month Lows, Resistance Potential at Prior Support (March Lows)
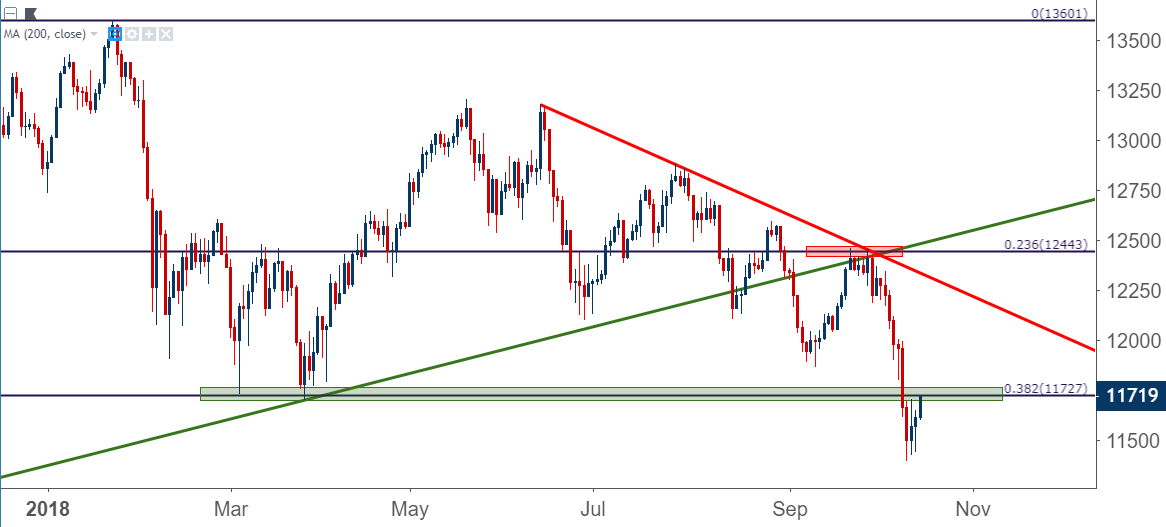
Chart prepared by James Stanley
To read more:
Are you looking for longer-term analysis on the U.S. Dollar? Our DailyFX Forecasts for Q4 have a section for each major currency, and we also offer a plethora of resources on USD-pairs such as EUR/USD, GBP/USD, USD/JPY, AUD/USD. Traders can also stay up with near-term positioning via our IG Client Sentiment Indicator.
Forex Trading Resources
DailyFX offers a plethora of tools, indicators and resources to help traders. For those looking for trading ideas, our IG Client Sentiment shows the positioning of retail traders with actual live trades and positions. Our trading guides bring our DailyFX Quarterly Forecasts and our Top Trading Opportunities; and our real-time news feed has intra-day interactions from the DailyFX team. And if you’re looking for real-time analysis, our DailyFX Webinars offer numerous sessions each week in which you can see how and why we’re looking at what we’re looking at.
If you’re looking for educational information, our New to FX guide is there to help new(er) traders while our Traits of Successful Traders research is built to help sharpen the skill set by focusing on risk and trade management.
--- Written by James Stanley, Strategist for DailyFX.com
Contact and follow James on Twitter: @JStanleyFX


