


US Dollar Tests 95.00 as Dow, S&P Recover From Key Supports
Last week’s sell-off took a step into the rearview mirror today as stocks showed some semblance of recovery after running into support last week. As investigated last Thursday, Q3 was a very bullish outlay for global equities, particularly American stocks as both the S&P 500 and the Dow ran up to fresh all-time-highs. But a week into Q4 and pain started to show – and that theme held through last week’s sell-off. We’re now in the early stages of recovery, and another wave of selling cannot be ruled out.
For most intents and purposes, price action in currencies was relatively calm by comparison with many markets trading within predefined near-term structure. The Dollar has posed a move back-down to a well-worn support area around 95.00 and even the Euro is adhering to recent structure. Below, we parse through a series of price action-based setups.
Talking Points:
- If you’re looking to improve your trading approach, our Traits of Successful Traders research could help. This is based on research derived from actual results from real traders, and this is available to any trader completely free-of-charge.
- If you’re looking for a primer on the FX market, we can help. To get a ground-up explanation behind the Forex market, please click here to access our New to FX Trading Guide.
If you’d like to sign up for our webinars, we host an event on Tuesday and Thursday, each of which can be accessed from the below links:
Tuesday: Tuesday, 1PM ET
Thursday: Thursday 1PM ET
Stocks Come Back to Life – Can Bulls Continue to Recover Prior Losses?
Last Friday produced a bounce from a number of key support levels, and part of the Weekly Technical Forecast for Equities was looking for strength to return to the Dow. While both the Dow and the S&P had put in support indications, the Dow held above the 200-Day Moving Average while the S&P 500 temporarily traded below. Even this morning, prices had found a bit of resistance off of the 200 Day Moving Average in the S&P, and this, at the very least, made it a less attractive vehicle to trade for a recovery of last week’s sell-offs.
Dow Jones Daily Price Chart: Bounce From Confluent Support

Chart prepared by James Stanley
S&P 500 Tests 2800 – Now What?
In this week’s technical forecast, I tried to utilize caution with the S&P 500. Support plays looking for a bounce appeared to be more attractive in the Dow given the support structure in the above chart; but for the S&P 500, I wanted to see a test back-above 2800 to re-open the door for topside. That’s happened today, and now the big question is whether higher-low support can set-in to open the door for trending strategies in the index. An area of interest for such an observation exists around 2784.
SPX Hourly Price Chart

Chart prepared by James Stanley
US Dollar Adheres to Pre-Defined Structure, Re-Tests 95.00
As noted earlier, currencies, by comparison, have been relatively calm. For many majors, this likely emanates from a lack of discernible trend in the US Dollar. Last week’s resistance at 96.00 helped to push DXY back-down to 95.00, and despite a quick test below earlier this morning, sellers appear to remain in control of near term price action for now given the recent lower-lows and lower-highs.
This means taking a stance around the US Dollar would entail traders trying to pick their spots with prevailing trends in other currencies, such as GBP/USD strength or AUD/USD weakness.
US Dollar Four-Hour Price Chart

Chart prepared by James Stanley
EUR/USD Re-Tests Resistance
Going along with that lack of noticeable near-term trends in the Dollar has been a similar observation in EUR/USD. Traders can, however, glean an element of a bias here: A zone of resistance that runs from 1.1590-1.1625 can be matched up with an ascending trend-line taken off of this week’s lows. This could open the door to a short-term bullish pattern in the pair, looking for prices to make a move towards the longer-term resistance zone that runs around the 1.1700-handle.
EUR/USD Four-Hour Price Chart

Chart prepared by James Stanley
GBP/USD Messy, but Bullish Bias Remains
Cable was in an interesting spot a couple of weeks ago, and this was part of the FX Setups of the Week, looking for the bullish bias that’s held since the middle of August to continue playing out. To be sure, this is not expected to be a smooth ride as Brexit headlines continue to dominate the flow; but this is often what helps to create higher-lows and/or lower-highs, meshing market dynamics with that headline-driven price action so that themes and trends can show their hands.
In GBP/USD, this has been a messy, albeit pronounced up-trend. Last week I had looked at a higher-low support zone that runs from 1.3098-1.3117, and this week brought a gap down to the bottom portion of that zone. Support held, and prices have since worked back-up to resistance around the 1.3200-handle. This keeps the door open for topside setups in the pair.
GBP/USD Four-Hour Price Chart

Chart prepared by James Stanley
USD/JPY Catches Support at Big Level – Price Action Remains Bearish
The one pair that really seemed to echo the equity sell-offs last week, albeit to a lesser degree, was USD/JPY. Yen-strength remained fairly visible throughout the period, catching a reprieve on Friday and again today as equity bulls took off for the races.
But – in USD/JPY, that short-term bearish structure is still there, and until bulls are able to punch through the 112.50 area, that theme remains. This could be used to setup other trades, particularly based on risk-on or risk-off themes, which was looked at in the EUR/JPY, GBP/JPY Analyst Pick published earlier today.
USD/JPY Four-Hour Price Chart

Chart prepared by James Stanley
EUR/JPY Tests Above Bearish Channel – Return of the Bulls?
This was part of FX Setups of the Week for October 8th, and at the time there were both bullish and bearish setups on EUR/JPY. The longer-term setup had a bull flag formation but, shorter-term, there was a descending triangle formation within that channel.
The bearish setup filled in fairly quickly after last week’s open, and prices soon cleared the first target at 130.00. But it was around the level of 129.20 where the music began to stop and over the next few days, prices continued to work on support. This week saw price action in EUR/JPY test above the bearish channel and this, when combined with that build of support around 129.10 opens the door for topside, as was looked at in the Analyst Pick published earlier on the day. In that pick, I closed off the remainder of the short position and triggered long.
EUR/JPY Four-Hour Price Chart

Chart prepared by James Stanley
GBP/JPY Approaches Key Resistance
For much of the past month, GBP/JPY has been in a messy, non-directional state. Price action in the pair opened the week by gapping-down to a fresh monthly low, from which we’ve mostly recovered at this point. But, as prices near a key area on the chart, the door remains open for bearish setups and this was matched with that bullish setup in EUR/JPY looked at above.
GBP/JPY finding resistance between 148.55-149.05 opens the door for short-side setups with stops lodged above the October swing high of 149.51.
GBP/JPY Four-Hour Price Chart
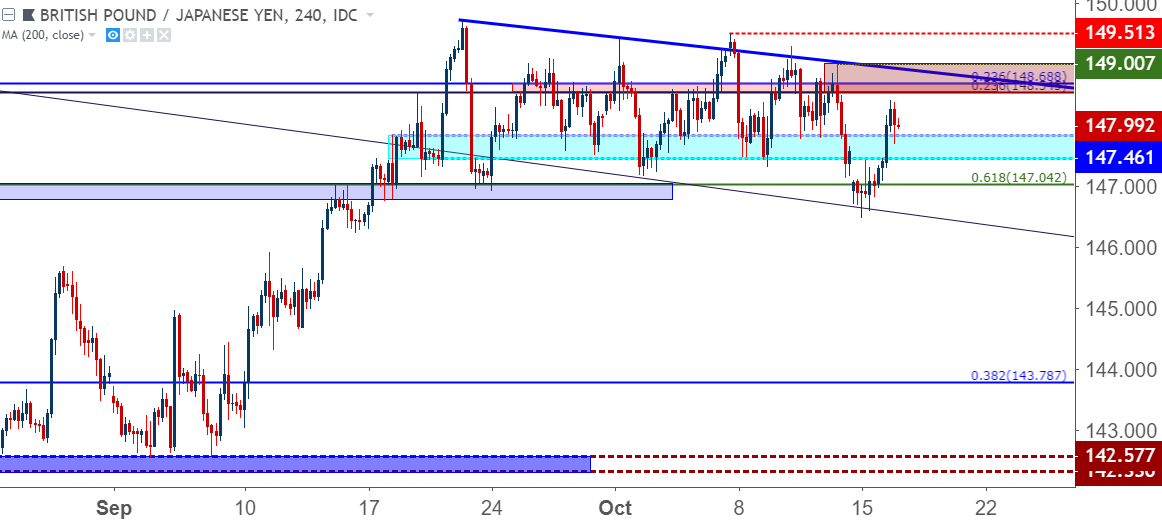
Chart prepared by James Stanley
To read more:
Are you looking for longer-term analysis on the U.S. Dollar? Our DailyFX Forecasts for Q4 have a section for each major currency, and we also offer a plethora of resources on USD-pairs such as EUR/USD, GBP/USD, USD/JPY, AUD/USD. Traders can also stay up with near-term positioning via our IG Client Sentiment Indicator.
Forex Trading Resources
DailyFX offers an abundance of tools, indicators and resources to help traders. For those looking for trading ideas, our IG Client Sentiment shows the positioning of retail traders with actual live trades and positions. Our trading guides bring our DailyFX Quarterly Forecasts and our Top Trading Opportunities; and our real-time news feed has intra-day interactions from the DailyFX team. And if you’re looking for real-time analysis, our DailyFX Webinars offer numerous sessions each week in which you can see how and why we’re looking at what we’re looking at.
If you’re looking for educational information, our New to FX guide is there to help new(er) traders while our Traits of Successful Traders research is built to help sharpen the skill set by focusing on risk and trade management.
--- Written by James Stanley, Strategist for DailyFX.com
Contact and follow James on Twitter: @JStanleyFX


