USD/CAD daily chart
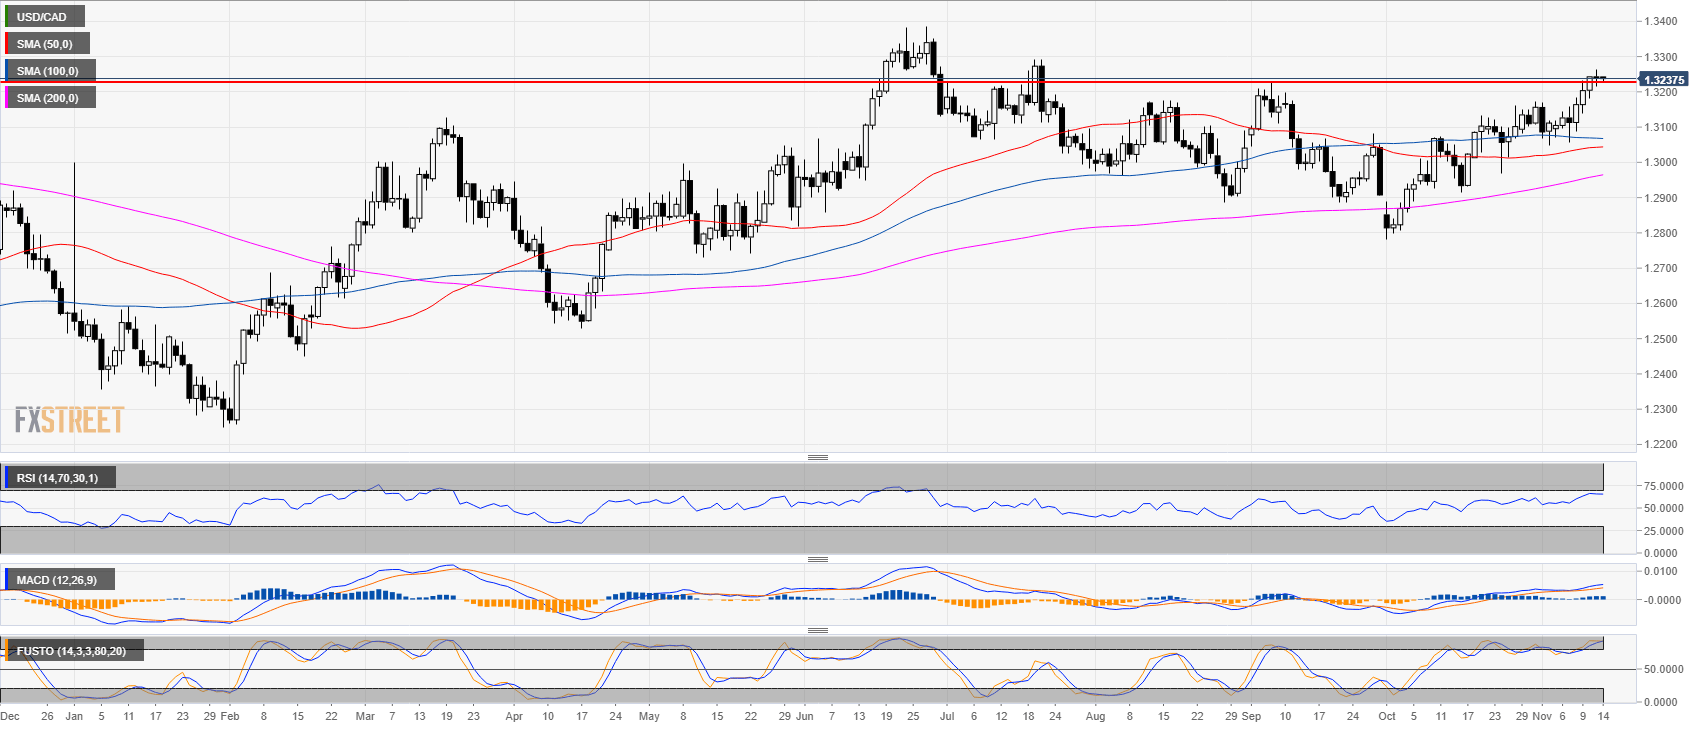
- USD/CAD is ending Tuesday virtually unchanged below 1.3250 brick wall.
- USD/CAD is attempting to break meaningfully above the September high.
USD/CAD 4-hour chart
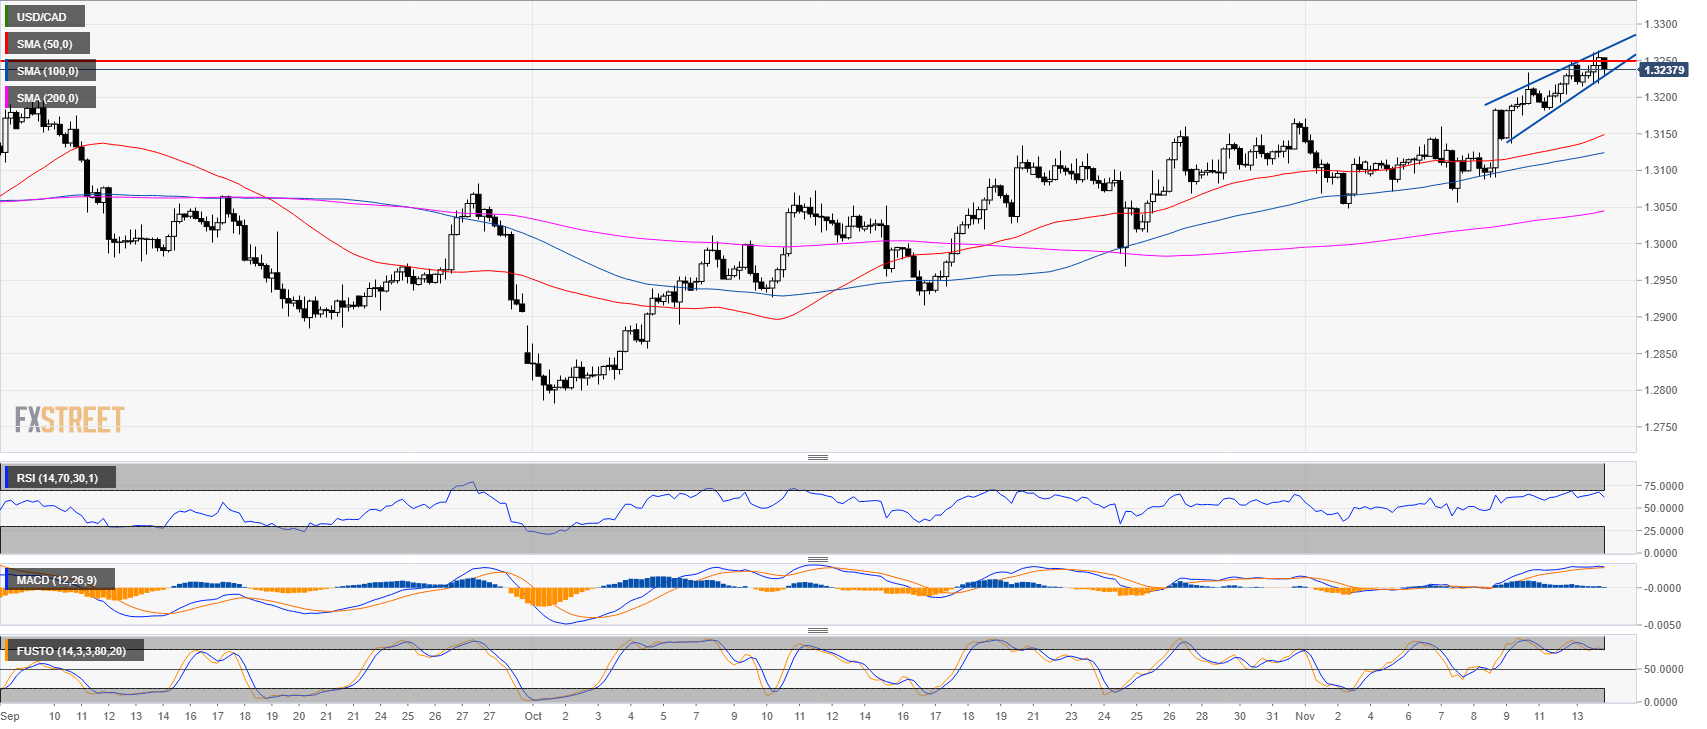
- USD/CAD is evolving in a small rising wedge just below 1.3250 in what appears to be a crowded trade to the upside.
- The Stochastic indicator is decelerating.
USD/CAD 30-minute chart
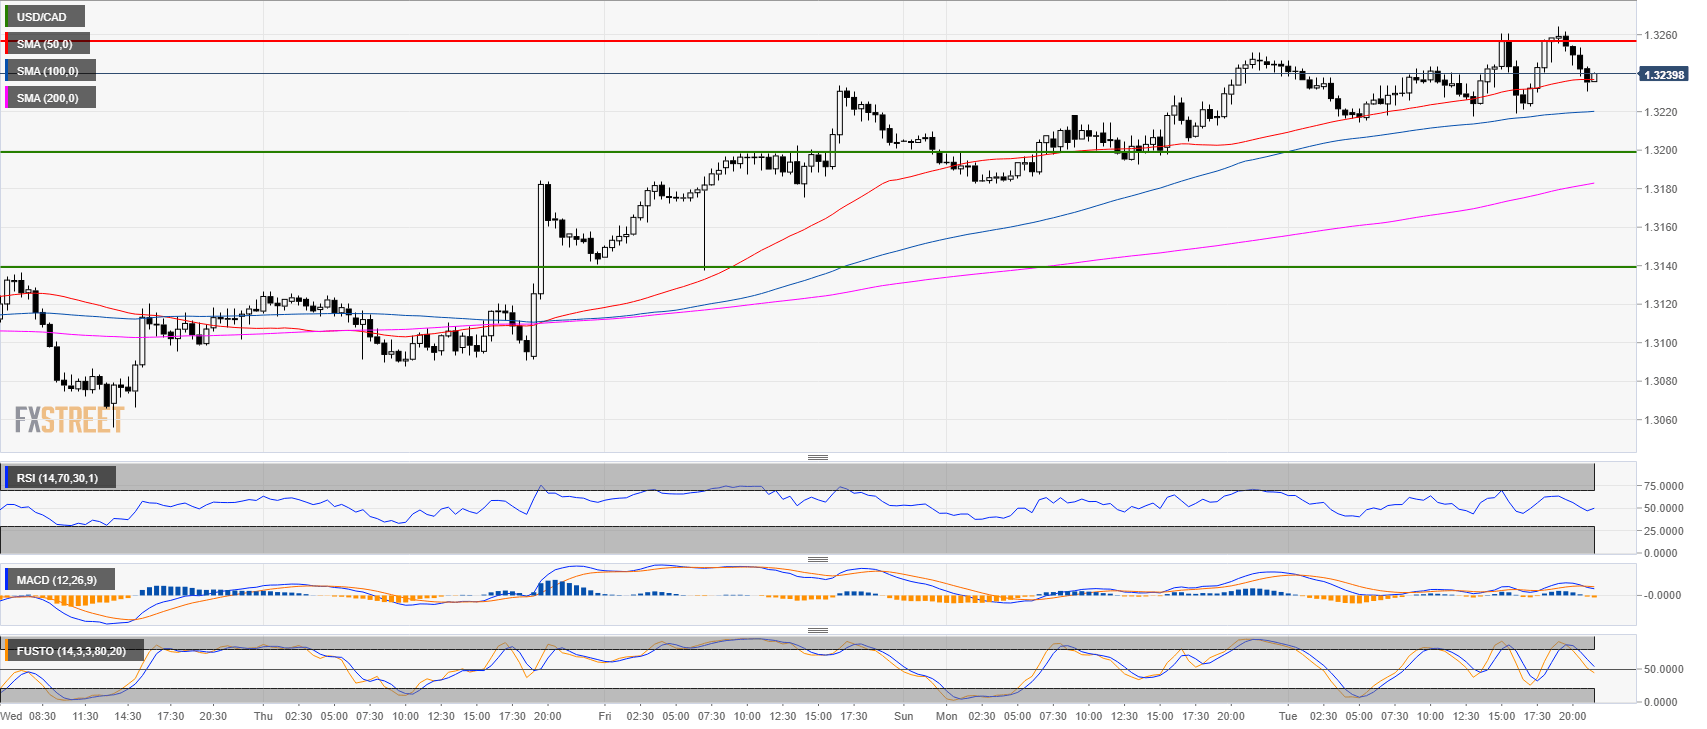
- Bulls objective is to break above 1.3250. It is most likely that any attempts above the level would soon fail.
- Bears will try to reach 1.3200 and 1.3140 to the downside.
Additional key levels at a glance:
USD/CAD
Overview:
Last Price: 1.3238
Daily change: -5.0 pips
Daily change: -0.0378%
Daily Open: 1.3243
Trends:
Daily SMA20: 1.3106
Daily SMA50: 1.3041
Daily SMA100: 1.3071
Daily SMA200: 1.2951
Levels:
Daily High: 1.3245
Daily Low: 1.3182
Weekly High: 1.3233
Weekly Low: 1.3056
Monthly High: 1.3172
Monthly Low: 1.2783
Daily Fibonacci 38.2%: 1.3221
Daily Fibonacci 61.8%: 1.3206
Daily Pivot Point S1: 1.3202
Daily Pivot Point S2: 1.3161
Daily Pivot Point S3: 1.314
Daily Pivot Point R1: 1.3264
Daily Pivot Point R2: 1.3285
Daily Pivot Point R3: 1.3326
Note: All information on this page is subject to change. The use of this website constitutes acceptance of our user agreement. Please read our privacy policy and legal disclaimer. Opinions expressed at FXstreet.com are those of the individual authors and do not necessarily represent the opinion of FXstreet.com or its management. Risk Disclosure: Trading foreign exchange on margin carries a high level of risk, and may not be suitable for all investors. The high degree of leverage can work against you as well as for you. Before deciding to invest in foreign exchange you should carefully consider your investment objectives, level of experience, and risk appetite. The possibility exists that you could sustain a loss of some or all of your initial investment and therefore you should not invest money that you cannot afford to lose. You should be aware of all the risks associated with foreign exchange trading, and seek advice from an independent financial advisor if you have any doubts.
Recommended content
Editors’ Picks
AUD/USD failed just ahead of the 200-day SMA

Finally, AUD/USD managed to break above the 0.6500 barrier on Wednesday, extending the weekly recovery, although its advance faltered just ahead of the 0.6530 region, where the key 200-day SMA sits.
EUR/USD met some decent resistance above 1.0700

EUR/USD remained unable to gather extra upside traction and surpass the 1.0700 hurdle in a convincing fashion on Wednesday, instead giving away part of the weekly gains against the backdrop of a decent bounce in the Dollar.
Gold keeps consolidating ahead of US first-tier figures

Gold finds it difficult to stage a rebound midweek following Monday's sharp decline but manages to hold above $2,300. The benchmark 10-year US Treasury bond yield stays in the green above 4.6% after US data, not allowing the pair to turn north.
Bitcoin price could be primed for correction as bearish activity grows near $66K area

Bitcoin (BTC) price managed to maintain a northbound trajectory after the April 20 halving, despite bold assertions by analysts that the event would be a “sell the news” situation. However, after four days of strength, the tables could be turning as a dark cloud now hovers above BTC price.
Bank of Japan's predicament: The BOJ is trapped

In this special edition of TradeGATEHub Live Trading, we're joined by guest speaker Tavi @TaviCosta, who shares his insights on the Bank of Japan's current predicament, stating, 'The BOJ is Trapped.'