


GOLD & CRUDE OIL TALKING POINTS:
- Gold prices may resume selloff on US CPI uptick, hawkish Powell remarks
- Crude oil prices suffer largest drop in almost three years on OPEC outlook
- API inventory flow data eyed after oil prices break uptrend from 2016 low
Gold prices struggled for meaningful upside progress despite a weaker US Dollar, which typically boosts anti-fiat demand for the yellow metal. That might reflect traders’ unwillingness to commit ahead of key event risk on the horizon.
US CPI is expected to rebound to 2.5 percent in October after hitting a seven-month low of 2.3 percent in the prior month, and an upside surprise seems plausible. That may boost Fed rate hike bets, a shift that may be reinforced by scheduled comments from dependably hawkish Fed Chair Jerome Powell.
As it stands, the markets price in a 76.6 percent probability of a rate hike in December and two more increases in 2019. For their part, Fed officials have projected three increases next year. A repricing of baseline bets closer toward the central bank’s scenario is likely to weigh on gold.
CRUDE OIL EYES INVENTORY DATA AMID BRUTAL SELLOFF
Meanwhile, crude oil prices suffered the largest one-day loss since February 2016 as OPEC downgraded its demand outlook for next year. Meanwhile, the EIA drilling productivity report said output will rise by a further 113k barrels per day in December.
Looking ahead, APIinventory flow statistics are in focus. The outcome will be sized up against forecasts calling for official EIA statistics to reveal a 2.89 million barrel increase. Prices may fall further if API calls for a larger inflow, whereas a more modest increase or even a surprise draw may inspire a bounce.
Learn what other traders’ gold buy/sell decisions say about the price trend!
GOLD TECHNICAL ANALYSIS
Gold prices continue to hover at upward-sloping counter-trend support, now at 1199.27. Breaking below this barrier targets the 1180.86-87.83 area next. Alternatively, a daily close back above support-turned-resistance in the 1211.05-14.30 region paves the way for a retest of the 1260.80-66.44 zone.

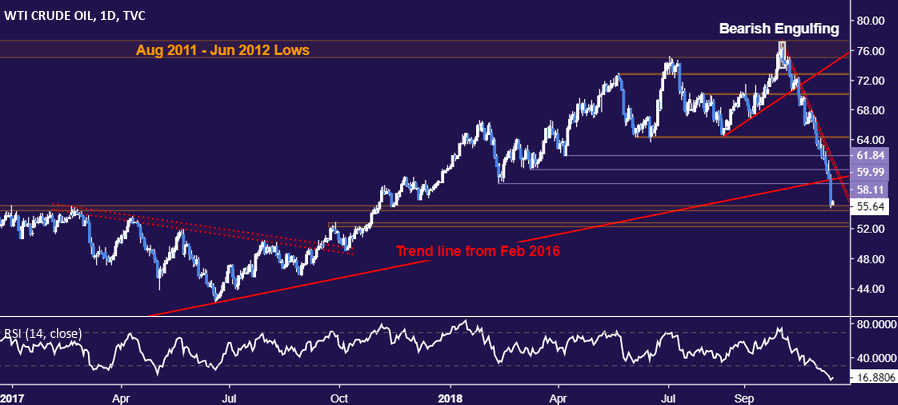
CRUDE OIL TECHNICAL ANALYSIS
Crude oil prices plunged through support guiding the uptrend from February 2016, ratifying long-term topping cues and opening the door deeper losses. For now, a daily close below support in the 54.48-55.21 area opens the door for a test of the 52.34-83 zone. Immediate support-turned-resistance is at 58.11, with a reversal back above that and the underside of trend line support at 58.67 exposes the $60/bbl figure anew.
COMMODITY TRADING RESOURCES
- See our guide to learn about the long-term forces driving crude oil prices
- Having trouble with your strategy? Here’s the #1 mistake that traders make
- Join a Trading Q&A webinar to answer your commodity market questions
--- Written by Ilya Spivak, Currency Strategist for DailyFX.com
To contact Ilya, use the comments section below or @IlyaSpivak on Twitter


