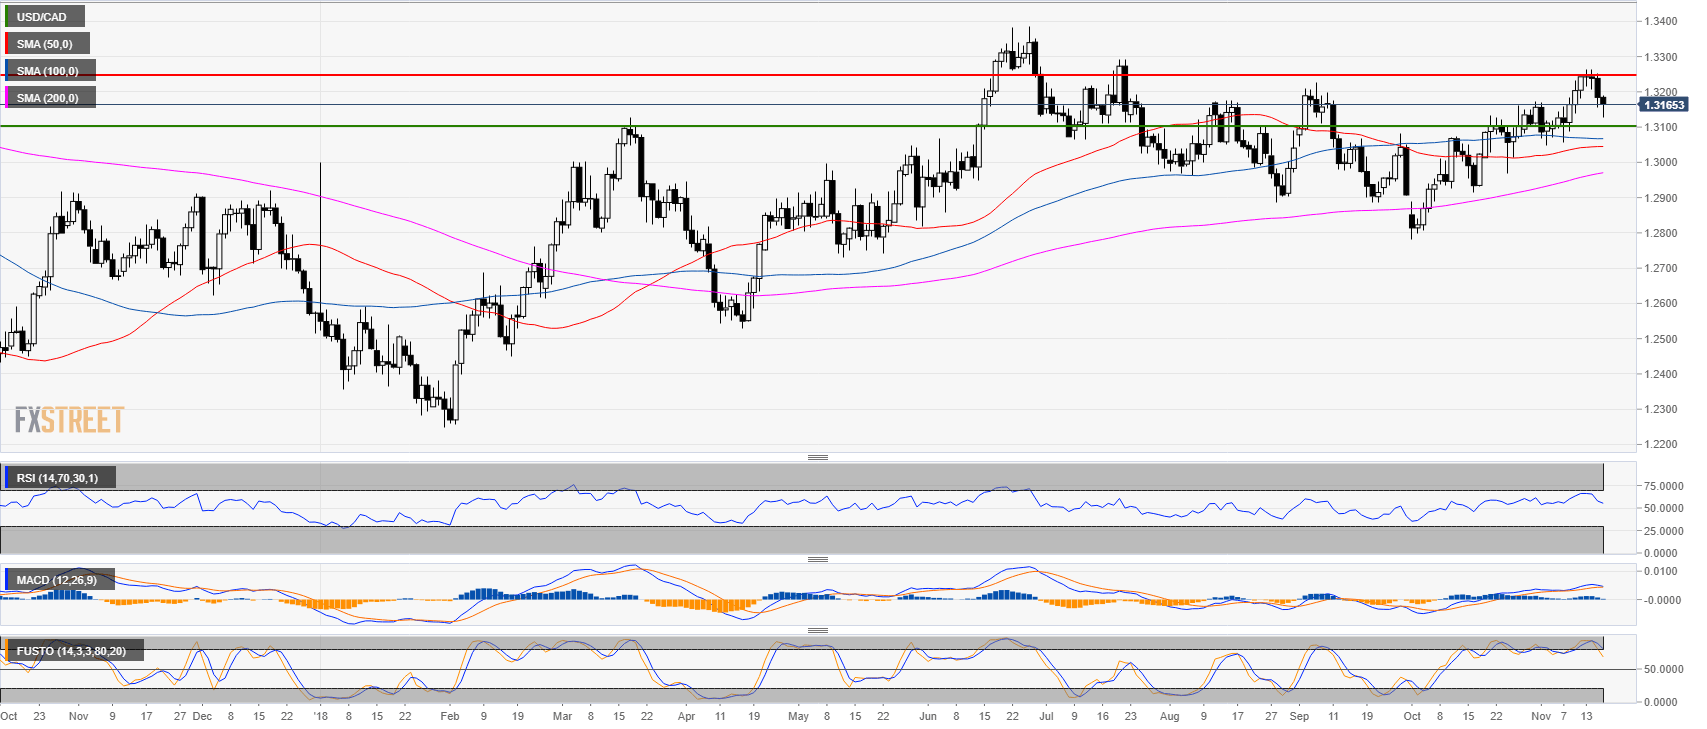
USD/CAD daily chart
- USD/CAD found strong resistance at the 1.3250 level.
- Technical indicators are starting to lose momentum but are still in positive territories.
USD/CAD 4-hour chart
- Bears had a strong bear breakout to 1.3150 and the 100-period simple moving average (SMA).
- USD/CAD remains bearish below 1.3200 figure with a target at 1.3100 figure.

USD/CAD 30-minute chart
- USD/CAD is trading below its main SMAs suggesting continued bearish momentum in the near future.
-636779872889495740.png)
Additional key levels at a glance:
USD/CAD
Overview:
Last Price: 1.3164
Daily change: -20 pips
Daily change: -0.152%
Daily Open: 1.3184
Trends:
Daily SMA20: 1.3137
Daily SMA50: 1.3045
Daily SMA100: 1.3068
Daily SMA200: 1.2963
Levels:
Daily High: 1.3253
Daily Low: 1.3156
Weekly High: 1.3233
Weekly Low: 1.3056
Monthly High: 1.3172
Monthly Low: 1.2783
Daily Fibonacci 38.2%: 1.3193
Daily Fibonacci 61.8%: 1.3216
Daily Pivot Point S1: 1.3143
Daily Pivot Point S2: 1.3101
Daily Pivot Point S3: 1.3046
Daily Pivot Point R1: 1.3239
Daily Pivot Point R2: 1.3294
Daily Pivot Point R3: 1.3336
Note: All information on this page is subject to change. The use of this website constitutes acceptance of our user agreement. Please read our privacy policy and legal disclaimer. Opinions expressed at FXstreet.com are those of the individual authors and do not necessarily represent the opinion of FXstreet.com or its management. Risk Disclosure: Trading foreign exchange on margin carries a high level of risk, and may not be suitable for all investors. The high degree of leverage can work against you as well as for you. Before deciding to invest in foreign exchange you should carefully consider your investment objectives, level of experience, and risk appetite. The possibility exists that you could sustain a loss of some or all of your initial investment and therefore you should not invest money that you cannot afford to lose. You should be aware of all the risks associated with foreign exchange trading, and seek advice from an independent financial advisor if you have any doubts.
Recommended content
Editors’ Picks
AUD/USD jumps above 0.6500 after hot Australian CPI data

AUD/USD extended gains and recaptured 0.6500 in Asian trading, following the release of hotter-than-expected Australian inflation data. The Australian CPI rose 1% in QoQ in Q1 against 0.8% forecast, providing extra legs to the Australian Dollar upside.
USD/JPY hangs near 34-year high at 154.88 as intervention risks loom

USD/JPY is sitting at a multi-decade high of 154.88 reached on Tuesday. Traders refrain from placing fresh bets on the pair as Japan's FX intervention risks loom. Broad US Dollar weakness also caps the upside in the major. US Durable Goods data are next on tap.
Gold price cautious despite weaker US Dollar and falling US yields

Gold retreats modestly after failing to sustain gains despite fall in US Treasury yields, weaker US Dollar. XAU/USD struggles to capitalize following release of weaker-than-expected S&P Global PMIs, fueling speculation about potential Fed rate cuts.
Crypto community reacts as BRICS considers launching stablecoin for international trade settlement

BRICS is intensifying efforts to reduce its reliance on the US dollar after plans for its stablecoin effort surfaced online on Tuesday. Most people expect the stablecoin to be backed by gold, considering BRICS nations have been accumulating large holdings of the commodity.
US versus the Eurozone: Inflation divergence causes monetary desynchronization

Historically there is a very close correlation between changes in US Treasury yields and German Bund yields. This is relevant at the current juncture, considering that the recent hawkish twist in the tone of the Fed might continue to push US long-term interest rates higher and put upward pressure on bond yields in the Eurozone.