
Advertisement
Advertisement
AUD/USD Forex Technical Analysis – Main Trend Changed to Up on Weekly Chart
By:
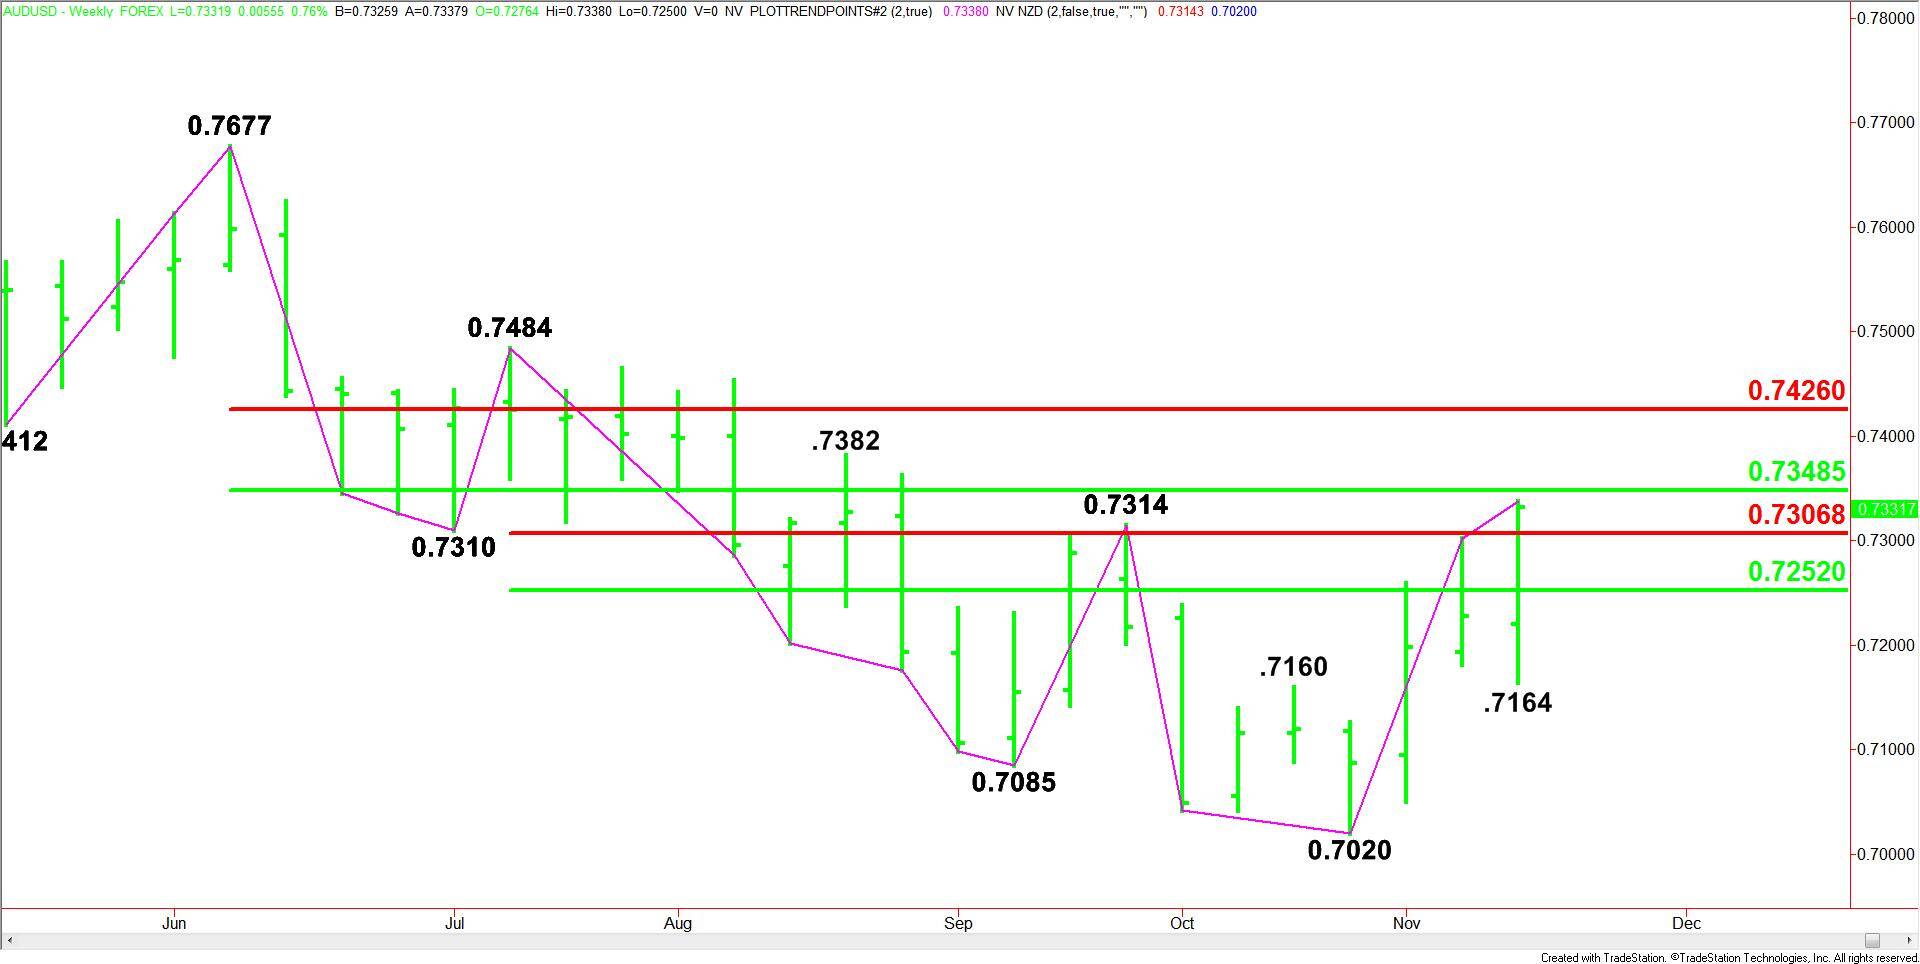
Based on last week’s close at .7332, the direction of the AUD/USD this week is likely to be determined by trader reaction to the Fibonacci level at .7307. The main trend is up according to the weekly swing chart. The trend turned up last week on a move through .7314. The next main top target is .7484. The trend will change to down on a trade through .7020.

The Australian Dollar surged last week helped by numerous factors including a better-than-expected employment report and a softer tone from U.S. officials about global economic growth. The strong Australian Employment Change report and positive Unemployment Rate helped increase the chances of an interest rate hike by the Reserve Bank of Australia. Investors are now pricing in a 40-percent chance of a 25 basis point increase in the cash rate target in August 2019, up from 25-percent.
The AUD/USD settled the week at .7332, up 0.0104 or 1.43%.
The Aussie was further helped on Friday after U.S. Federal Reserve Vice Chair Richard Clarida told CNBC he saw some evidence of global growth cooling. Clarida also noted key U.S. short-term borrowing rates are close to neutral and said being at neutral “makes sense.” Bullish Aussie traders read this comment to mean the No. 2 Fed official may be open for the Fed to pause its rate-hike campaign sooner than previously thought.
Weekly Swing Chart Technical Analysis
The main trend is up according to the weekly swing chart. The trend turned up last week on a move through .7314. The next main top target is .7484. The trend will change to down on a trade through .7020.
The minor trend is also up on the weekly swing chart. The minor trend will change to down on a trade through .7164. This will also shift momentum to the downside.
Retracement Level Analysis
The short-term range is .7484 to .7020. Its retracement zone is .7252 to .7307. The close over the upper or Fibonacci level at .7307 shifts the bias to the upside. This zone is new support.
The main range is .7677 to .7020. Its retracement zone at .7349 to .7426 is the next upside target zone. Inside this zone is a minor top at .7382. Sellers could come in on the first test of this zone. Overtaking it, however, will indicate the buying is getting stronger.
Weekly Swing Chart Technical Forecast
Based on last week’s close at .7332, the direction of the AUD/USD this week is likely to be determined by trader reaction to the Fibonacci level at .7307.
Bullish Scenario
A sustained move over .7307 will indicate the presence of buyers. If the upside momentum continues then look for a further move into the 50% level at .7349. This is a potential trigger point for an acceleration into the Fib level at .7426. Taking out this level will likely extend the rally into the main top at .7484.
Bearish Scenario
A sustained move under .7307 will signal the presence of sellers. This could lead to a retest of the 50% level at .7252. Since the main trend is up, buyers could come in on a test of this level.
If .7252 fails then look for a further decline. This move will indicate the AUD/USD needs more time to form a solid support base.
About the Author
James Hyerczykauthor
James is a Florida-based technical analyst, market researcher, educator and trader with 35+ years of experience. He is an expert in the area of patterns, price and time analysis as it applies to futures, Forex, and stocks.
Did you find this article useful?
Latest news and analysis


Advertisement