
Bitcoin Bulls See A Small Ray Of Light At The End Of The Tunnel
Bitcoin hit a new low just above $4,000 on Tuesday and stabilized since then. Many are asking: is the sell-off over and BTC/USD can conquer $5,000? Or will the granddaddy of cryptocurrencies lose $4,000? Technical levels provide some hope for the bulls.
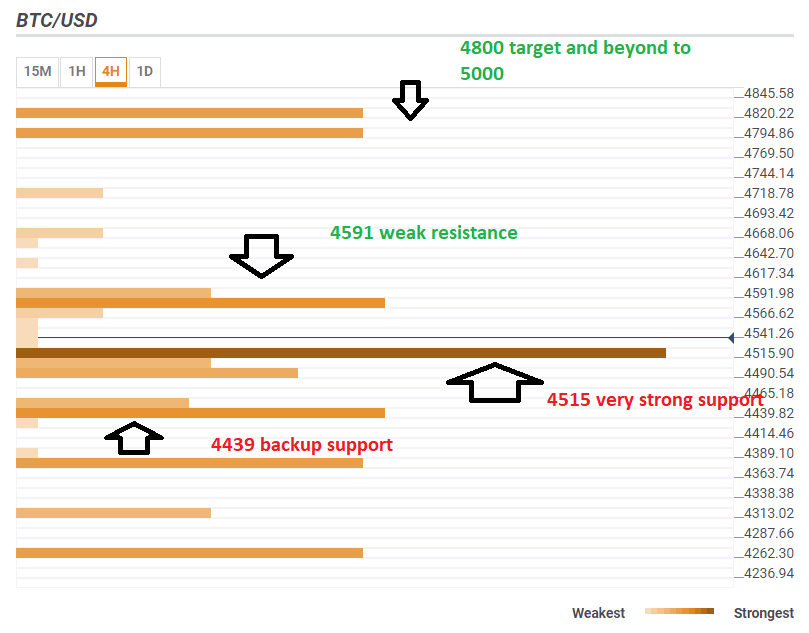
The Technical Confluence Indicator shows that Bitcoin ists above a critical convergence at $4,515. The area consists of the Bolinger Band 15m-Middle, the Pivot Point one-week Support 2, the Simple Moving Average 5-1h, and the SMA 5-4h.
Looking up, resistance at $4,591 is weaker than the support line mentioned earlier. The lines include the SMA 10-4h, the Fibonacci 61.8% one-day, and the previous hourly high.
Looking beyond, a Bitcoin bull rally can target the $4,800 area where we see the Bollinger Band one-day Lower and the Pivot Point one-day Resistance 1. These are not very strong levels and such a run could open the door to recapturing $5,000.
Further down, another noteworthy cushion awaits at $4,439. It consists of the SMA 10-1h, the BB 1h-Middle, and the SMA 100-15m.
Looking up, there is some resistance
Here is how it looks on the tool:
The Confluence Detector finds exciting opportunities using Technical Confluences. The TC is a tool to locate and point out those price levels where there is a congestion of indicators, moving averages, Fibonacci levels, Pivot Points, etc. Knowing where these congestion points are located is very useful for the trader, and can be used as a basis for different strategies.
Disclaimer: Foreign exchange (Forex) trading carries a high level of risk and may not be suitable for all investors. The risk grows as the leverage is higher. Investment objectives, risk appetite and ...
more

