US Dollar Support Bounce Runs into Trend-Line Resistance
US Dollar Talking Points:
- The US Dollar posed a vigorous bounce yesterday after a one-week sell-off followed fresh yearly highs. Support showed at a key area on the chart, and buyers took care of the rest as prices soon jumped up to find resistance on a bearish trend-line connecting the highs of the past week. Tomorrow brings the Thanksgiving holiday in the United States, and even the day after is expected to be low-liquidity across markets as equity exchanges in the US are only open for half of the day, set to close at 1PM ET.
- On that topic of stocks, sellers continued to push yesterday, bringing on fresh November lows in both the S&P 500 and the Dow Jones Industrial Average. In the tech-heavy Nasdaq 100, prices fell down to fresh seven-month lows, crossing the October swing as a number of tech names remain in a bearish state.
- DailyFX Forecasts on a variety of currencies such as the US Dollar or the Euro are available from the DailyFX Trading Guides page. If you’re looking to improve your trading approach, check out Traits of Successful Traders. And if you’re looking for an introductory primer to the Forex market, check out our New to FX Guide.
Do you want to see how retail traders are currently trading the US Dollar? Check out our IG Client Sentiment Indicator.
Yesterday was another rough outing for stocks as the Thanksgiving holiday nears, and this was coupled with a surge in the US Dollar after a key area of support came into play yesterday morning. Both the Dow and S&P 500 fell down to fresh November lows while catching support around their respective 2018 trend-line projections. This keeps US indices in a rather vulnerable position as the holiday nears, and even Friday will bring lower levels of liquidity during a partial session, as US exchanges are set to close at 1PM ET on Friday.
Dow Jones Daily Price Chart
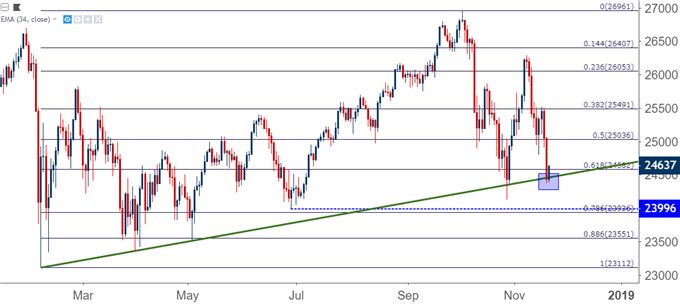
Chart prepared by James Stanley
US Dollar Support Bounce Runs into Trend-Line Resistance
Going along with those equity sell-offs yesterday was a surge in the US Dollar, and this comes after a week of pullback from fresh one-year highs. Last week saw a runaway trend continue in the US Dollar as the currency gapped-up and continued to run, eventually climbing above the 97.50 marker, albeit temporarily. I warned against chasing the move as it appeared that a bull trap was building, and over the next week the US Dollar sank all the way back down towards the 96.00 area on the chart.
As discussed yesterday, this is the 50% marker of the 2017-2018 down-trend in the US Dollar, and this is the same price that helped to set resistance on four separate occasions in October. This appeared to be the big level that finally pulled bulls back into the market, as yesterday’s support test led into a surge of strength in the currency.
US Dollar Four-Hour Price Chart: Support Bounce From Prior October Resistance
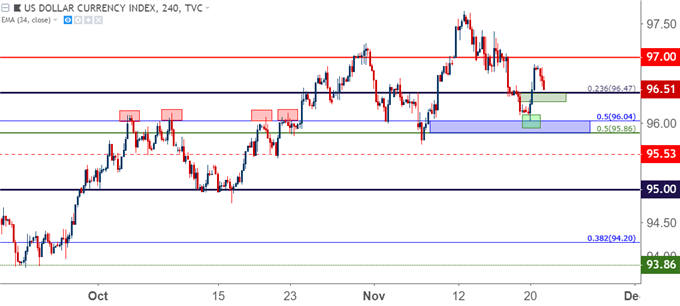
Chart prepared by James Stanley
At this point, the US Dollar has run into another technical item, an that’s a bearish trend-line that’s been setting since last week’s pullback began. That resistance has held so far throughout the morning, and this opens the door for another item of support, of which the 96.47 level remains interesting. This is the 23.6% Fibonacci retracement of the 2011-2017 major move in the US Dollar, and a hold of support here would give a higher-low that could open the door for bullish setups in the currency.
US Dollar Hourly Price Chart
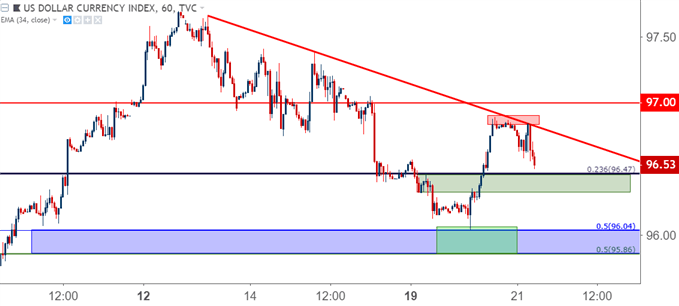
Chart prepared by James Stanley
EUR/USD Bounces After Sell-Off From Resistance
Going along with that surge in US Dollar strength yesterday was a fairly visible drop in EUR/USD after the currency ran into a key resistance zone. This resistance zone runs from 1.1448-1.1500, and this has been in play in EUR/USD since October, when it helped to hold up support for the first portion of the month before soon becoming resistance.
EUR/USD Four-Hour Price Chart
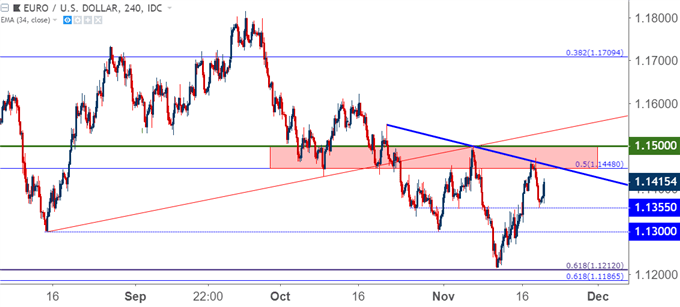
Chart prepared by James Stanley
That sell-off ran all the way down to 1.1355, which is a prior area of both support and resistance; and buyers have so far responded to produce a higher-low on short-term charts. This may be pointing to a deeper move of strength and perhaps even another resistance test on the pair. This could make for a difficult backdrop around short-side continuation going into the holiday.
EUR/USD Two-Hour Price Chart
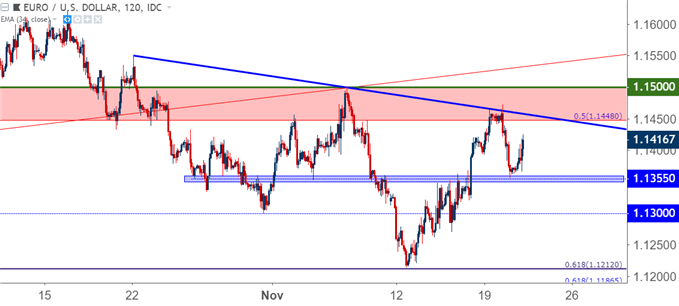
Chart prepared by James Stanley
USD/CAD Pulls Back from Fresh Four-Month Highs
USD/CAD was set up fairly interesting coming into this week, as last Friday brought a support test at a key area on the chart. The level of 1.3132 is the 61.8% Fibonacci retracement of the May-September, 2017 move in the pair, and this level lined up fairly well with a bullish trend-line taken from the lows of the past seven weeks. That support test led to a rather vigorous bounce that’s seen prices jump up to fresh four-month highs, and now there’s a bit of a pullback to work with. This keeps the door open for support potential around prior resistance, and given the churn that was seen at that prior area, this is a rather large area. The key would be for buyer support to show above last week’s swing-low in order to keep the door open for bullish continuation strategies.
USD/CAD Four-Hour Price Chart: Support Potential Around Prior Resistance
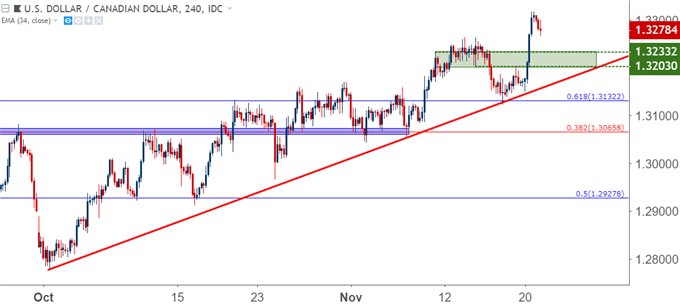
Chart prepared by James Stanley
To read more:
Are you looking for longer-term analysis on the U.S. Dollar? Our DailyFX Forecasts for Q4 have a section for each major currency, and we also offer a plethora of resources on USD-pairs such as EUR/USD, GBP/USD, USD/JPY, AUD/USD. Traders can also stay up with near-term positioning via our IG Client Sentiment Indicator.
Forex Trading Resources
DailyFX offers a plethora of tools, indicators and resources to help traders. For those looking for trading ideas, our IG Client Sentiment shows the positioning of retail traders with actual live trades and positions. Our trading guides bring our DailyFX Quarterly Forecasts and our Top Trading Opportunities; and our real-time news feed has intra-day interactions from the DailyFX team. And if you’re looking for real-time analysis, our DailyFX Webinars offer numerous sessions each week in which you can see how and why we’re looking at what we’re looking at.
If you’re looking for educational information, our New to FX guide is there to help new(er) traders while our Traits of Successful Traders research is built to help sharpen the skill set by focusing on risk and trade management.
--- Written by James Stanley, Strategist for DailyFX.com
Contact and follow James on Twitter: @JStanleyFX


