Talking Points – AUD/USD, AUD/JPY, EUR/AUD, RSI Divergence
- As anticipated, AUD/USD and AUD/JPY turned lower after negative RSI divergences
- Meanwhile, EUR/AUD had its best week since January after positive RSI divergence
- These currencies may extend their performance as the Australian Dollar takes a hit
Have a question about what’s in store for Australian Dollar next week? Join a Trading Q&A Webinar to ask it live!
AUD/USD Technical Outlook: Bearish
Last week, we noted multiple RSI divergence reversal signals in AUD/USD, AUD/JPY and EUR/AUD. The significance of divergence is that it shows fading momentum. These provided early warning signals that the Australian Dollar might have been on the verge of depreciating against most of its major peers. That was indeed the case for all three mentioned above.
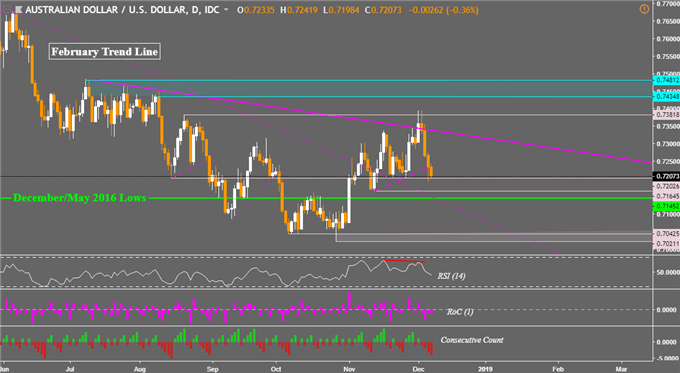
Starting with AUD/USD, the pair turned lower after failing to push above the descending resistance line from July. Here, negative RSI divergence preceded a turn lower as Aussie Dollar headed for its lowest close since mid-November. Prices are now sitting right on horizontal support at 0.72026 which begins with the August 15th low. We did have a descent through a near-term rising support line from November 13th and more declines could be in store ahead. A push through 0.71452 exposes the current 2018 lows.
AUD/USD Daily Chart

AUD/JPY Technical Outlook:Bearish
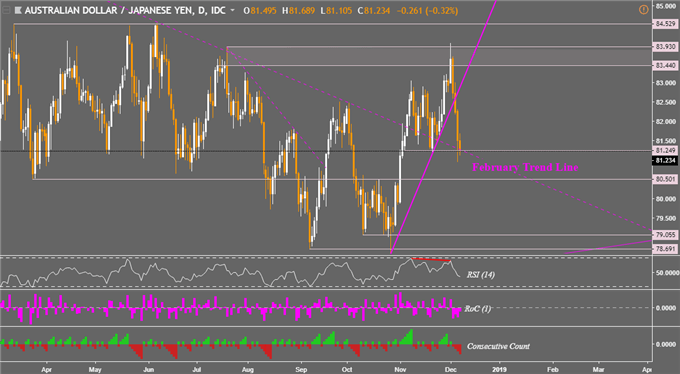
Negative RSI divergence was also present in AUD/JPY last week, since then the pair fell about 3.35%. In its descent, AUD/JPY fell through a rising support line from October which is a bearish signal. But, prices have paused their descent at the February trend line on the chart below. This is also combined with horizontal support at 81.24. Still, AUD/JPY was heading for its lowest close since early November and more losses may be in the cards ahead. Near-term support is at 80.50.
AUD/JPY Daily Chart

EUR/AUD Technical Outlook:Bullish
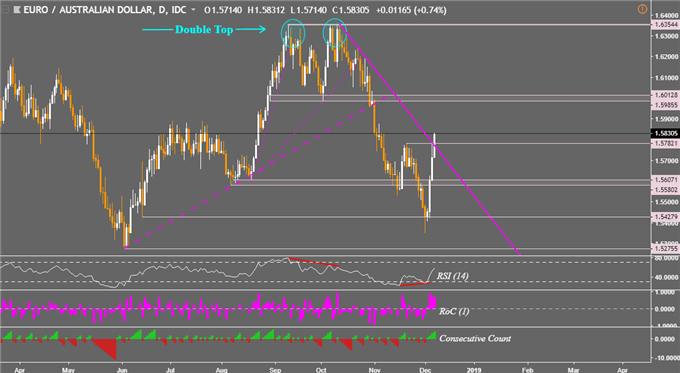
Meanwhile, last week EUR/AUD was overshadowed by positive RSI divergence and that ended up preceding its best weekly performance (about 2.25%) since the last week of January this year. That also brought with it a push above a descending trend line from October. With confirmation of a turn higher, EUR/AUD could be on the verge of reversing its dominant downtrend which was initiated by a double top reversal candlestick pattern. From here, near-term resistance is a range between 1.5985 and 1.6012.
For updates on my coverage of the Australian Dollar, you may follow me on twitter @ddubrovsky for real-time news on major moves in Aussie crosses.
EUR/AUD Daily Chart

** Charts created in TradingView
--- Written by Daniel Dubrovsky, Junior Currency Analyst for DailyFX.com
To contact Daniel, use the comments section below or @ddubrovskyFX on Twitter


