


CRUDE OIL & GOLD TALKING POINTS:
- Crude oil prices fail to capitalize as OPEC+ secures output cut deal
- Gold prices soar as Fed rate hike bets drop after November jobs data
- Risk-off trade may bode well for gold as yields drop, crude oil at risk
Crude oil prices seemed unimpressed after OPEC and its allies – the so-called OPEC+ group that includes members of the cartel and major supplies like Russia – agreed to cut output by 1.2 million barrels per day next year. That is a bit higher than the 1 million cut expected.
That this did not push prices out of their recent range suggests traders are skeptical about the move’s ability to offset swelling supply from North America. Indeed, DOE data showed that US crude exports jumped to a record 3.2 million barrels just last week.
Gold prices roared higher after November’s US jobs data revealed a smaller than expected rise in nonfarm payrolls. The priced-in 2019 Fed rate hike outlook flattened and Treasury bond yields fell, boosting the relative appeal of non-interest-bearing alternatives epitomized by the yellow metal.
CRUDE OIL MAY FALL AS GOLD GAINS IN RISK-OFF TRADE
Looking ahead, sentiment trends may prove decisive amid a lull in top-tier economic data. Bellwether S&P 500 futures are pointing firmly lower, hinting at a risk-off mood. That might bode ill for cycle-sensitive crude oil prices but gold might continue higher as haven-seeking flows depress yields.
See our guide to learn about the long-term forces driving crude oil prices !
GOLD TECHNICAL ANALYSIS
Gold prices breached resistance in the 1235.24-41.64 area, opening the door for a test of the 1260.80-66.44 zone. This is reinforced by former trend support set form December 2015, now at 1272.43. The 1235.24 level has been recast as support, with a turn back below that targeting a rising trend line at 1207.78.

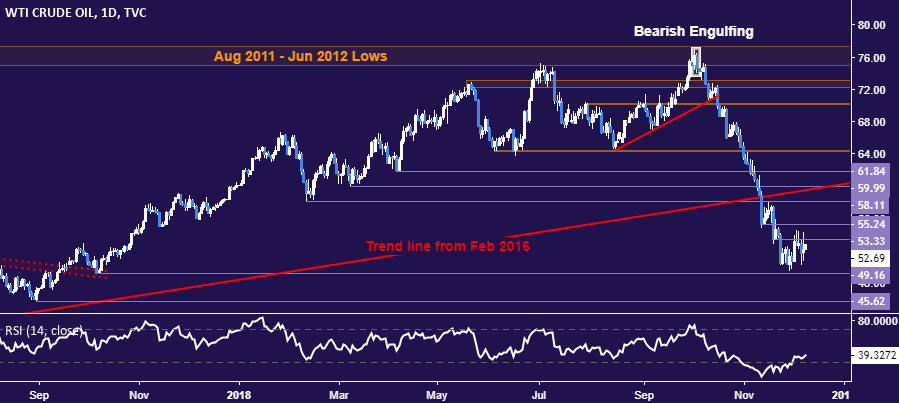
CRUDE OIL TECHNICAL ANALYSIS
Crude oil prices are treading water below resistance at 53.33 (former support, falling trend line). The range floor is marked by the October 9, 2017 low at 49.16, with break below that exposing the August 31, 2017 bottom at 45.62. Alternatively, a breach above 53.33 paves the way to test support-turned-resistance at 55.24.
COMMODITY TRADING RESOURCES
- Learn what other traders’ gold buy/sell decisions say about the price trend
- Having trouble with your strategy? Here’s the #1 mistake that traders make
- Join a Trading Q&A webinar to answer your commodity market questions
--- Written by Ilya Spivak, Currency Strategist for DailyFX.com
To contact Ilya, use the comments section below or @IlyaSpivak on Twitter


