
Advertisement
Advertisement
Natural Gas Price Prediction – Prices Rise on Lower Inventories
By:
Natural gas prices moved higher on Monday rising more than 2.5%, but remain rangebound generating a bull flag pattern. Prices are buoyed despite warmer
Natural gas prices moved higher on Monday rising more than 2.5%, but remain rangebound generating a bull flag pattern. Prices are buoyed despite warmer than normal weather which is expected to cover most of the United States for the next 8-14 days according to the National Oceanic Atmospheric Administration. Inventories are well below the 5-year average range for this time of year, while prices are still $2 per mmbtu below the 5-year high.
Technical Analysis
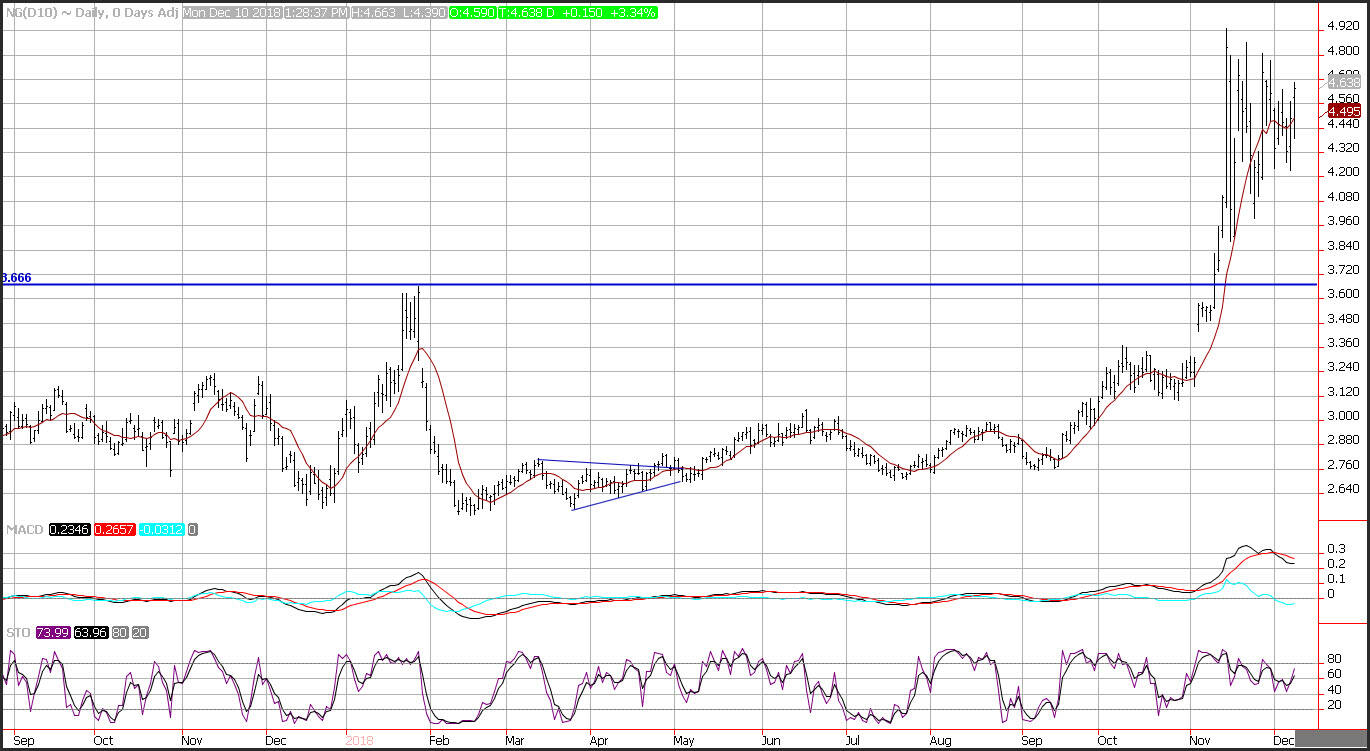
Natural gas prices moved higher on Monday and are forming a bull flag pattern which is a pause that refreshes higher. Support is seen near the 10-day moving average at 4.49. Resistance is seen near the November highs at 4.92. Short-term momentum has turned positive as the fast stochastic generated a crossover buy signal. The MACD (moving average convergence divergence) histogram prints in the red with a downward sloping trajectory which points to lower prices.
Supply remains flat
The EIA reports that the average total supply of natural gas remained the same as in the previous report week, averaging 92.7 Bcf per day. Dry natural gas production remained constant week over week. Average net imports from Canada decreased by 1% from last week.
Working gas stocks’ deficit to the five-year average and the deficit to the bottom of the five-year range both increase. In the Lower 48 states, total working gas stocks are 404 Bcf lower than the five-year minimum, and every storage region is currently lower than the bottom of its five-year range. The deficit to the bottom of the range increased in all regions except the Pacific and South Central salt regions. As of this report week, the Midwest region is 58 Bcf lower than the five-year minimum, and the South Central region, including both salt and nonsalt facilities, is 173 Bcf (16%) lower than the five-year minimum.
About the Author
David Beckerauthor
David Becker focuses his attention on various consulting and portfolio management activities at Fortuity LLC, where he currently provides oversight for a multimillion-dollar portfolio consisting of commodities, debt, equities, real estate, and more.
Did you find this article useful?
Latest news and analysis


Advertisement