


GOLD & CRUDE OIL TALKING POINTS:
- Gold prices struggle to capitalize on US Dollar pullback as yields rise
- Downside may also be capped as divergence holds amid risk-on trade
- Crude oil prices drop on US inventories data, IEA report next on tap
Gold prices inched marginally higher as the US Dollar retreated, boosting the appeal of anti-fiat alternatives. The move played out against the backdrop of improving risk appetite however, which buoyed bond yields and capped the non-interest-bearing yellow metal’s upward progress.
Interestingly, the risk-on move coincided with a rapidly rising British Pound even as Prime Minister Theresa May faced a vote of no confidence. The rally may reflect supportive comments from key officials shortly after the contest was made official, suggesting the markets expected May to prevail (as she did).
Meanwhile, crude oil prices tumbled as EIA inventory flow data showed stockpiles shed a meager 1.21 million barrels last week. Consensus forecasts envisioned an outflow of 3.17 million barrels and API data published Tuesday projected an even more dramatic 10.2 million barrel drawdown.
GOLD MAY STRUGGLE FOR DIRECTION, OIL EYES IEA REPORT
Looking ahead, gold prices may struggle for direction if bond yields and the US Dollar continue to diverge (as noted earlier in the week). S&P 500 futures are signaling a risk-on bias, which bodes ill for the yellow metal as rates follow shares higher. Losses may be mitigated by a weaker Greenback however.
Meanwhile, crude oil prices will be eyeing the IEA monthly report. Prices are likely to find their way lower if it suggests that slowing global growth will show up as weaker demand while swelling US output counteracts the latest OPEC+ plan to reduce output by 1.2 million barrels per day in 2019 versus this year.
Learn what other traders’ gold buy/sell decisions say about the price trend!
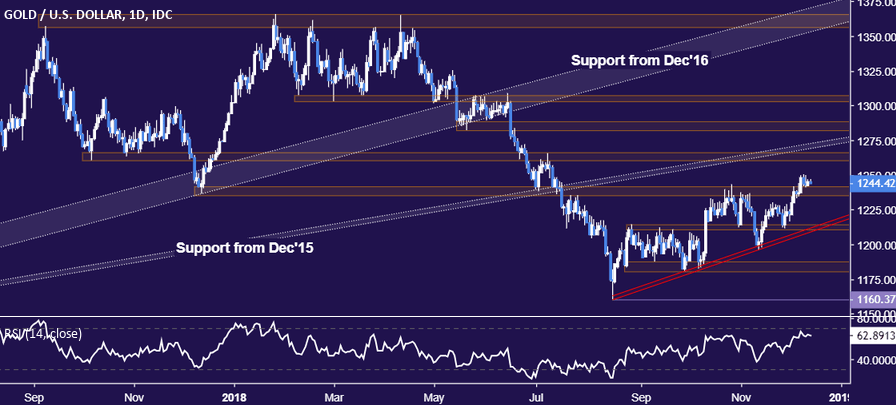
GOLD TECHNICAL ANALYSIS
Gold prices remain in digestion mode after breaking resistance-turned-support in the 1235.24-41.64 area. A move higher form here faces a cluster of resistance capped at 1273.48. Alternatively, a move back below 1235.24 opens the door for a test of rising trend line support at 1209.55.
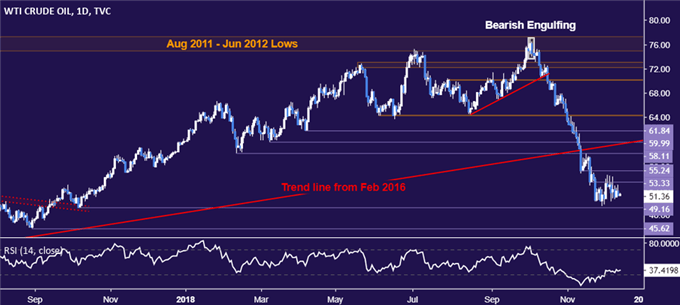
CRUDE OIL TECHNICAL ANALYSIS
Crude oil prices continue to mark time in a range capped by resistance at 53.33 (former support, falling trend line). Support is marked by the October 9, 2017 low at 49.16. A break downward exposes the August 31, 2017 bottom at 45.62. Alternatively, a daily close above the range top targets support-turned-resistance at 55.24.
COMMODITY TRADING RESOURCES
- See our guide to learn about the long-term forces driving crude oil prices
- Having trouble with your strategy? Here’s the #1 mistake that traders make
- Join a Trading Q&A webinar to answer your commodity market questions
--- Written by Ilya Spivak, Currency Strategist for DailyFX.com
To contact Ilya, use the comments section below or @IlyaSpivak on Twitter


