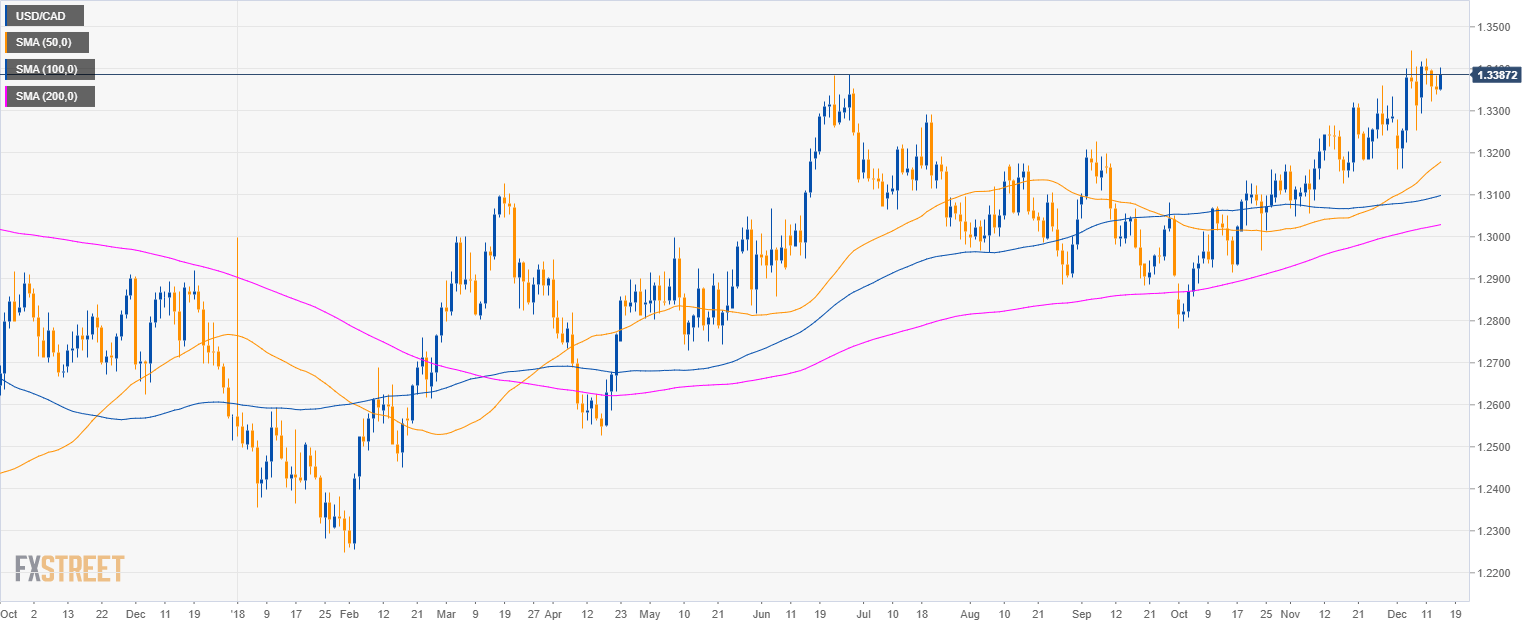
USD/CAD daily chart
- USD/CAD is trading in a bull trend above the 50, 100 and 200-day simple moving averages (SMAs).
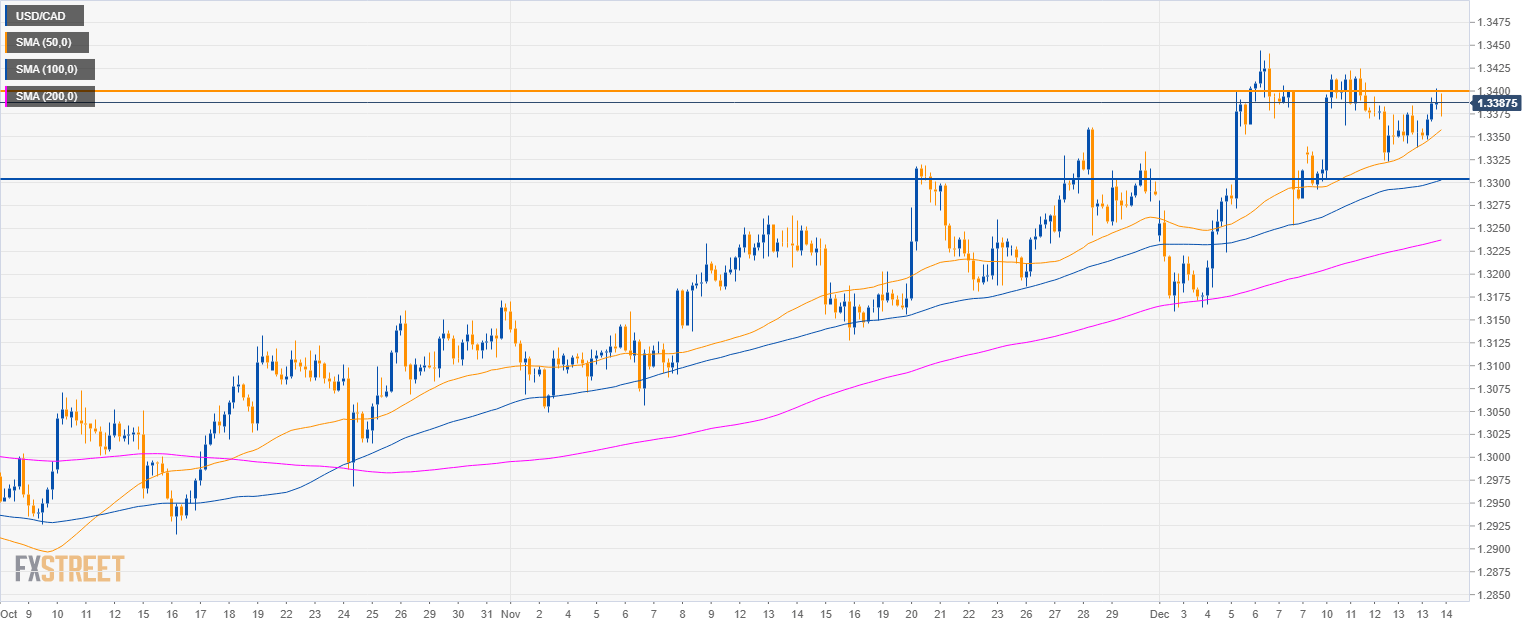
USD/CAD 4-hour chart
- 1.3400 figure is the level to beat for bulls.
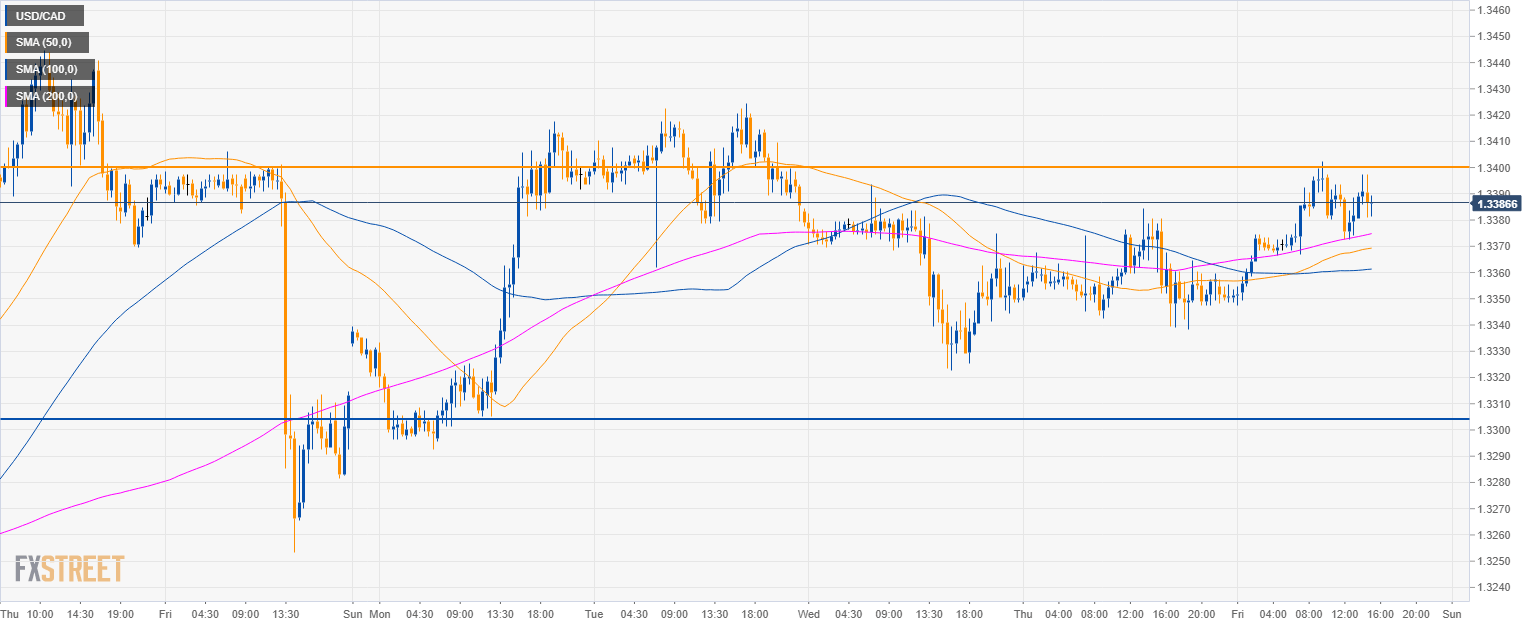
USD/CAD 30-minute chart
- USD/CAD is finding resistance at the 1.3400 figure. Any rally above it seems, at this stage, unsustainable.
- The next target is likely going to be the 1.3300 figure to the downside.
Additional key levels
USD/CAD
Overview:
Today Last Price: 1.3386
Today Daily change: 34 pips
Today Daily change %: 0.255%
Today Daily Open: 1.3352
Trends:
Previous Daily SMA20: 1.3286
Previous Daily SMA50: 1.3169
Previous Daily SMA100: 1.3095
Previous Daily SMA200: 1.3026
Levels:
Previous Daily High: 1.3384
Previous Daily Low: 1.3338
Previous Weekly High: 1.3445
Previous Weekly Low: 1.316
Previous Monthly High: 1.336
Previous Monthly Low: 1.3048
Previous Daily Fibonacci 38.2%: 1.3356
Previous Daily Fibonacci 61.8%: 1.3367
Previous Daily Pivot Point S1: 1.3332
Previous Daily Pivot Point S2: 1.3312
Previous Daily Pivot Point S3: 1.3286
Previous Daily Pivot Point R1: 1.3378
Previous Daily Pivot Point R2: 1.3404
Previous Daily Pivot Point R3: 1.3424
Note: All information on this page is subject to change. The use of this website constitutes acceptance of our user agreement. Please read our privacy policy and legal disclaimer. Opinions expressed at FXstreet.com are those of the individual authors and do not necessarily represent the opinion of FXstreet.com or its management. Risk Disclosure: Trading foreign exchange on margin carries a high level of risk, and may not be suitable for all investors. The high degree of leverage can work against you as well as for you. Before deciding to invest in foreign exchange you should carefully consider your investment objectives, level of experience, and risk appetite. The possibility exists that you could sustain a loss of some or all of your initial investment and therefore you should not invest money that you cannot afford to lose. You should be aware of all the risks associated with foreign exchange trading, and seek advice from an independent financial advisor if you have any doubts.
Recommended content
Editors’ Picks
EUR/USD clings to gains near 1.0700, awaits key US data

EUR/USD clings to gains near the 1.0700 level in early Europe on Thursday. Renewed US Dollar weakness offsets the risk-off market environment, supporting the pair ahead of the key US GDP and PCE inflation data.
USD/JPY keeps pushing higher, eyes 156.00 ahead of US GDP data

USD/JPY keeps breaking into its highest chart territory since June of 1990 early Thursday, recapturing 155.50 for the first time in 34 years as the Japanese Yen remains vulnerable, despite looming intervention risks. The focus shifts to Thursday's US GDP report and the BoJ decision on Friday.
Gold closes below key $2,318 support, US GDP holds the key

Gold price is breathing a sigh of relief early Thursday after testing offers near $2,315 once again. Broad risk-aversion seems to be helping Gold find a floor, as traders refrain from placing any fresh directional bets on the bright metal ahead of the preliminary reading of the US first-quarter GDP due later on Thursday.
Injective price weakness persists despite over 5.9 million INJ tokens burned
Injective price is trading with a bearish bias, stuck in the lower section of the market range. The bearish outlook abounds despite the network's deflationary efforts to pump the price.
Meta takes a guidance slide amidst the battle between yields and earnings

Meta's disappointing outlook cast doubt on whether the market's enthusiasm for artificial intelligence. Investors now brace for significant macroeconomic challenges ahead, particularly with the release of first-quarter GDP data.