
Advertisement
Advertisement
USD/JPY Forex Technical Analysis – Friday’s Inside Move Suggests Investor Indecision, Impending Volatility
By:
Friday’s inside trading range suggests investor indecision and impending volatility. Basically, a sustained move over 113.710 will indicate the presence of buyers. If this creates enough upside momentum then the rally could extend into the next main top at 114.036. Taking out Friday’s low at 113.191 will signal the presence of sellers. If this move creates enough downside momentum then look for the selling to possibly extend into the 50% level at 112.975 to 112.973. Look for a technical bounce on the first test of this zone.

The Dollar/Yen closed lower on Friday as extreme weakness in the global equity markets encouraged investors to seek shelter in the safe-haven Japanese Yen. Sellers hit the equity markets hard early in the session following the release of weaker-than-expected retail sales and industrial production from China. Later in the session, poor Euro Zone data contributed to a second round of selling pressure.
On Friday, the USD/JPY settled at 113.394, down 0.281 or -0.19%.
Last week, the USD/JPY settled higher three out of five sessions, primarily led by a reversal to the upside in U.S. equity markets. However, Dollar/Yen gains were capped late in the week as U.S. stock markets weakened.
Position-squaring ahead of the U.S. Federal Reserve interest rate and monetary policy decision on Wednesday and Thursday’s Bank of Japan interest rate decision.
Daily Swing Chart Technical Analysis
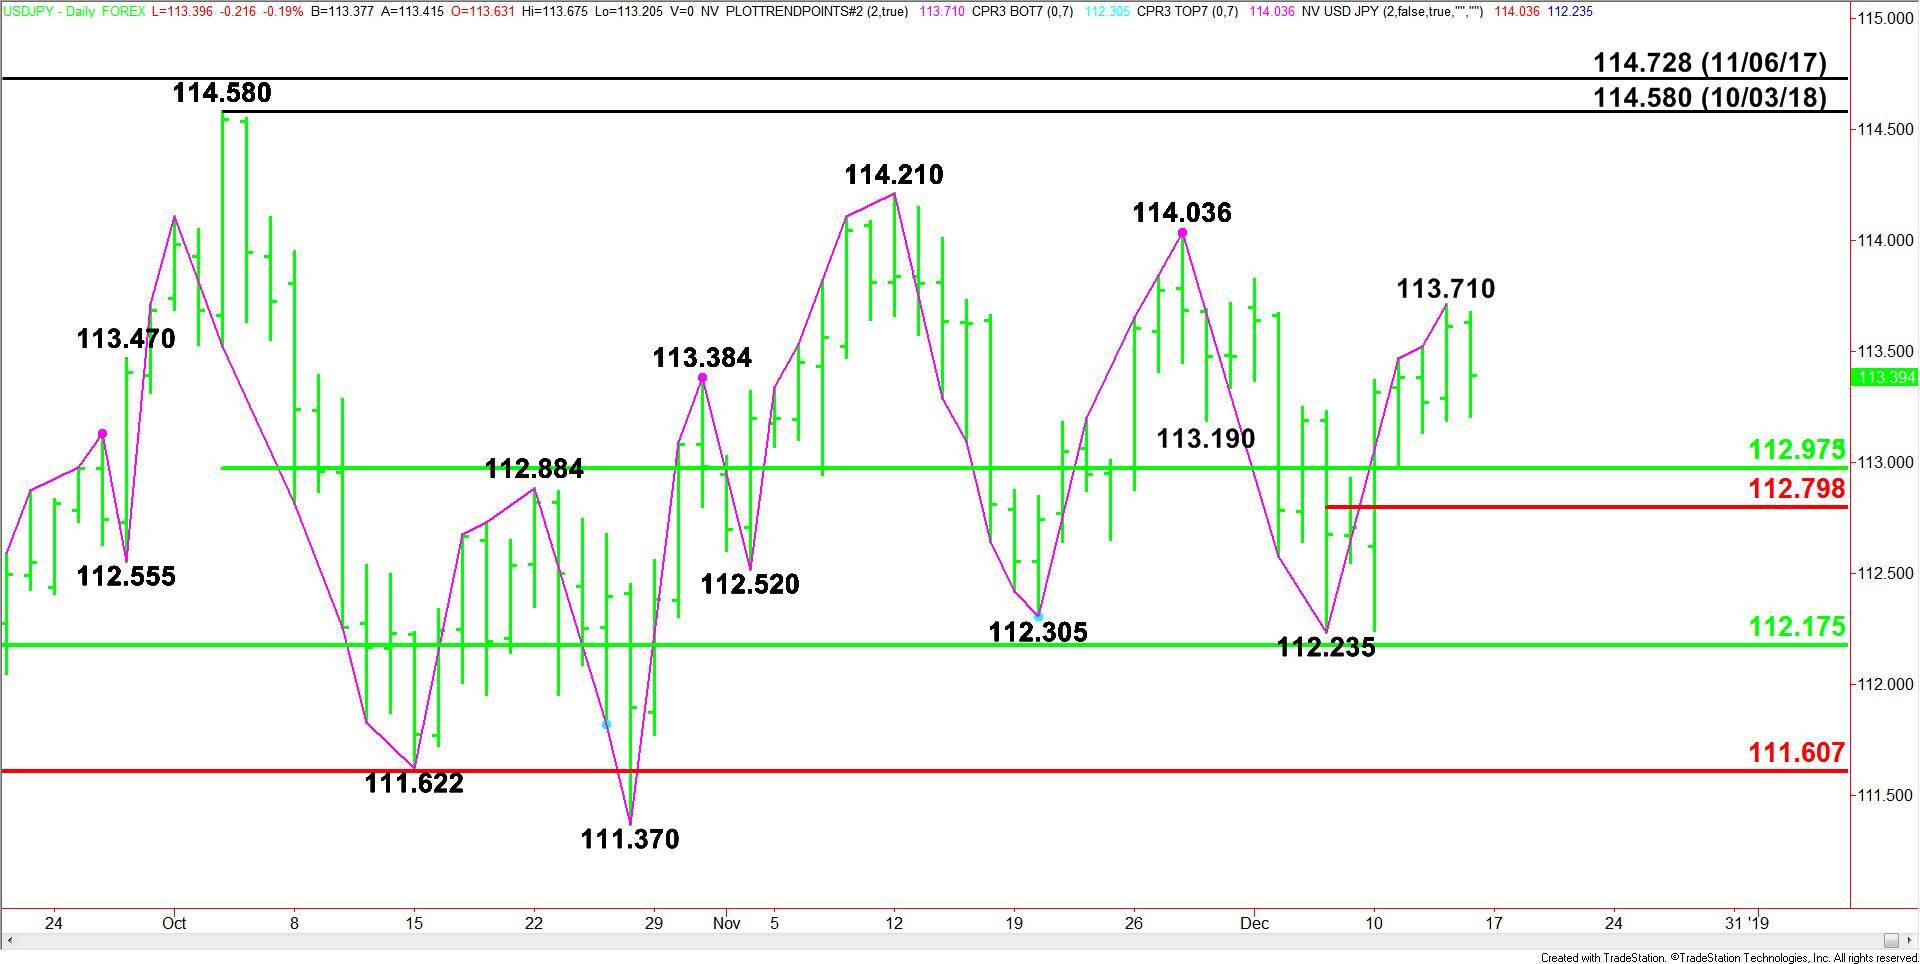
The main trend is down according to the daily swing chart. However, momentum trended higher last week. A trade through 114.036 will change the main trend to up. This is followed by another main top at 114.210. A trade through 112.235 will signal a resumption of the downtrend.
The main range is 114.580 to 111.370. The USD/JPY is currently trading on the strong side of its 50% level at 112.975. This is helping to generate the upside momentum. It is also new support.
The minor range is 112.235 to 113.710. Its retracement zone at 112.973 to 112.798 is also support. This helps create a 50% support cluster at 112.975 to 112.973.
Daily Swing Chart Technical Forecast
Friday’s inside trading range suggests investor indecision and impending volatility. Basically, a sustained move over 113.710 will indicate the presence of buyers. If this creates enough upside momentum then the rally could extend into the next main top at 114.036.
Taking out Friday’s low at 113.191 will signal the presence of sellers. If this move creates enough downside momentum then look for the selling to possibly extend into the 50% level at 112.975 to 112.973. Look for a technical bounce on the first test of this zone.
If 112.973 fails as support then look for the selling to possibly extend into the short-term Fibonacci level at 112.798.
Fundamentally, a stock market recovery, or increased demand for risk should be supportive for the USD/JPY. If equity markets continue their rapid sell-off then look for investors to seek shelter in the Japanese Yen. This should renew the pressure on the USD/JPY.
About the Author
James Hyerczykauthor
James is a Florida-based technical analyst, market researcher, educator and trader with 35+ years of experience. He is an expert in the area of patterns, price and time analysis as it applies to futures, Forex, and stocks.
Did you find this article useful?
Latest news and analysis


Advertisement