
Advertisement
Advertisement
AUD/USD Forex Technical Analysis – Daily Chart Indicates Plenty of Room to Downside Under .7163
By:
Based on last week’s price action and the close at .7175, the direction of the AUD/USD on Monday is likely to be determined by trader reaction to the Fibonacci level at .7163. Basically, look for an upside bias to develop on a sustained move over .7207 and for the downside bias to continue on a sustained move under .7163.

The Australian Dollar plunged on Friday on concerns about a weakening economy in China and Europe. The selling was fueled by safe-haven flows into the U.S. Dollar as risk appetite weakened following softer-than-expected economic data from China and the Euro Zone.
The selling initially began early in the session after China released reports showing economic activity in the world’s second largest economy mostly slowed in November. The data indicated weakness in both retail sales and industrial production. Additionally, German and Euro Zone purchasing mangers’ indexes for December also showed a slowdown in economic activity.
On Friday, the AUD/USD settled at .7175, down 0.0052 or -0.73%.
Daily Swing Chart Technical Analysis
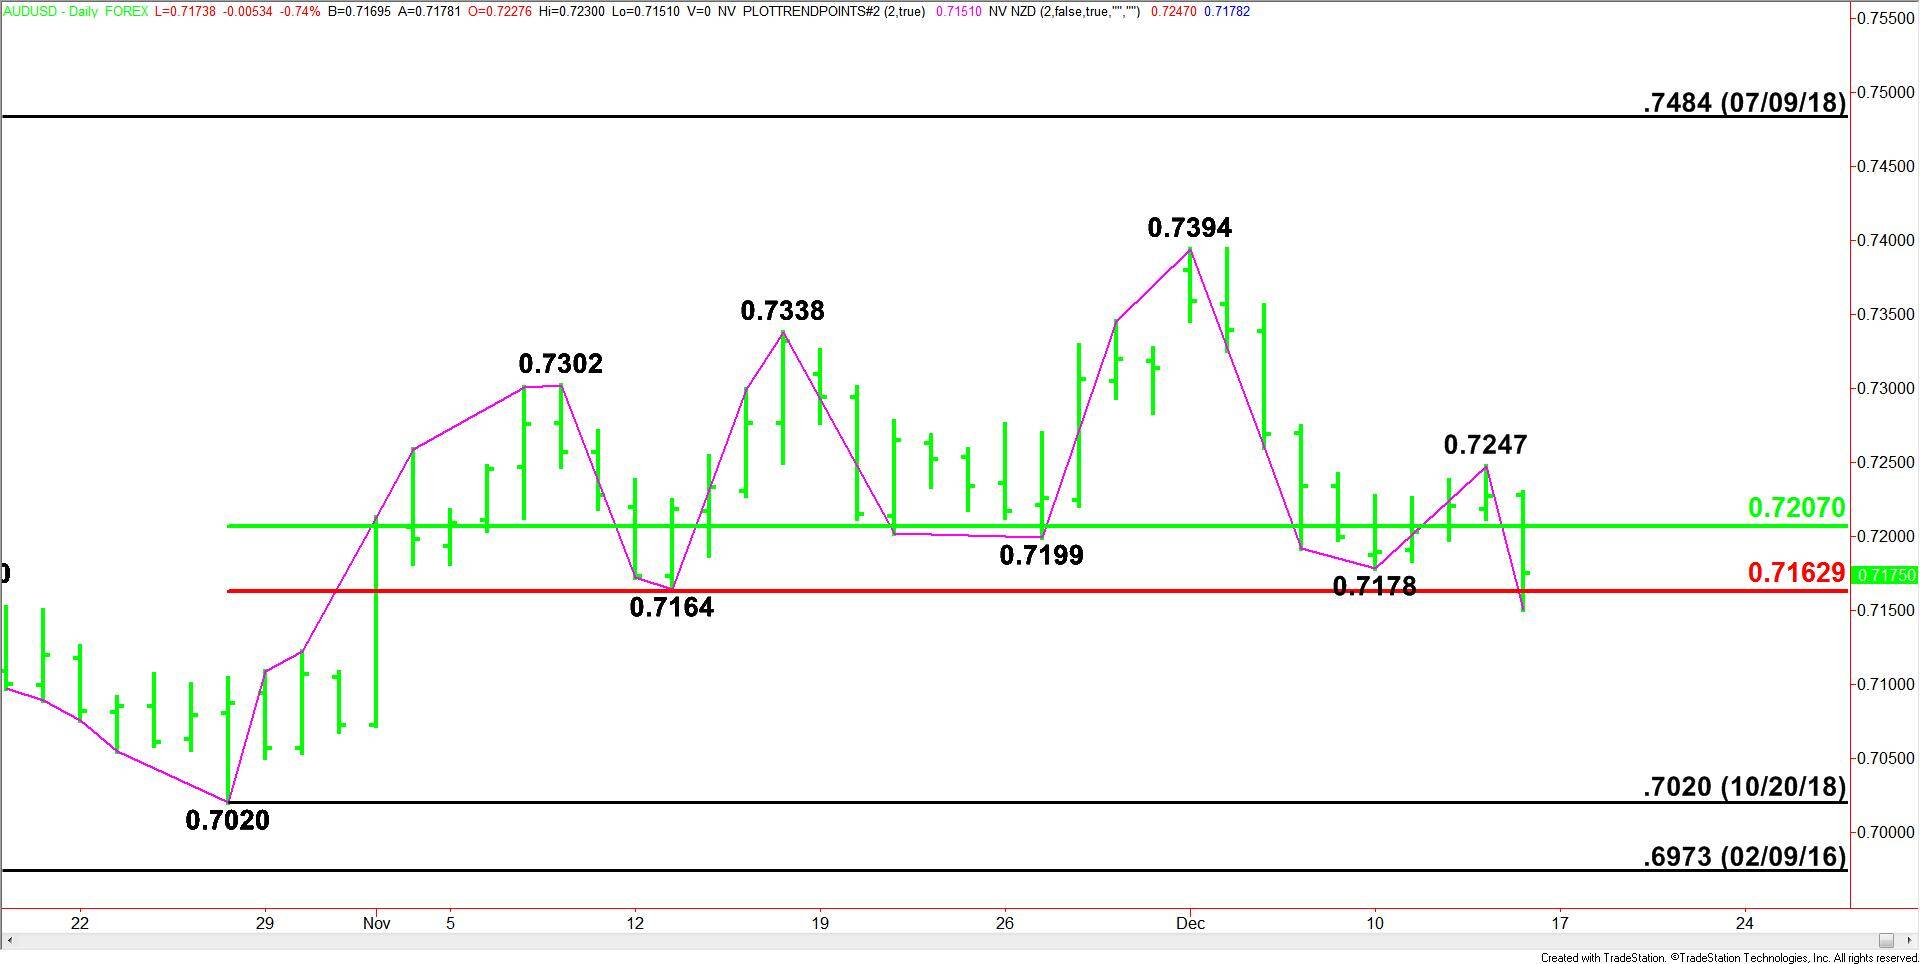
The main trend is down according to the daily swing chart. After consolidating for four sessions due to optimism over U.S-China trade talks, the AUD/USD spiked through the .7178 main bottom on Friday, reaffirming the downtrend. The selling was also strong enough to take out the November 13 main bottom at .7164.
The move also created a new main top at .7247. A trade through this top will change the main trend to up.
The main range is .7020 to .7394. The AUD/USD is also trading inside its retracement zone at .7207 to .7163. Trader reaction to this zone will determine the near-term direction of the Forex pair.
Daily Swing Chart Technical Forecast
Based on last week’s price action and the close at .7175, the direction of the AUD/USD on Monday is likely to be determined by trader reaction to the Fibonacci level at .7163.
Bullish Scenario
A sustained move over .7163 will indicate the presence of buyers. If this move generates enough upside momentum then look for the rally to extend into the 50% level at .7207.
Taking out .7207 will indicate the buying is getting stronger. This could trigger a move into the main top at .7247. Overcoming this level will change the main trend to up.
Bearish Scenario
A sustained move under .7163 will signal the presence of sellers. This could lead to an acceleration to the downside. The daily chart indicates there is plenty of room to break with the next major target the October 20 bottom at .7020.
Basically, look for an upside bias to develop on a sustained move over .7207 and for the downside bias to continue on a sustained move under .7163.
About the Author
James Hyerczykauthor
James is a Florida-based technical analyst, market researcher, educator and trader with 35+ years of experience. He is an expert in the area of patterns, price and time analysis as it applies to futures, Forex, and stocks.
Did you find this article useful?
Latest news and analysis


Advertisement