
Advertisement
Advertisement
E-mini Dow Jones Industrial Average (YM) Futures Analysis – Trading Below Pivot at 24369 Confirms Downside Bias
By:
The market is currently trading inside a range formed by a main bottom at 23894 and a pivot at 24369. Trader reaction to these levels will determine the direction of the December E-mini S&P 500 Index on Monday.

December E-mini Dow Jones Industrial Average futures are edging lower on Monday after giving back earlier gains. The market opened lower, but quickly turned higher in reaction to firm markets in Asia. There were no major events overnight so the price action may be investors positioning themselves ahead of Wednesday’s U.S. Federal Reserve interest rate and monetary policy decisions.
At 0817 GMT, December E-mini Dow Jones Industrial Average futures are trading 24081, down 33 or -0.12%.
Daily Swing Chart Technical Analysis
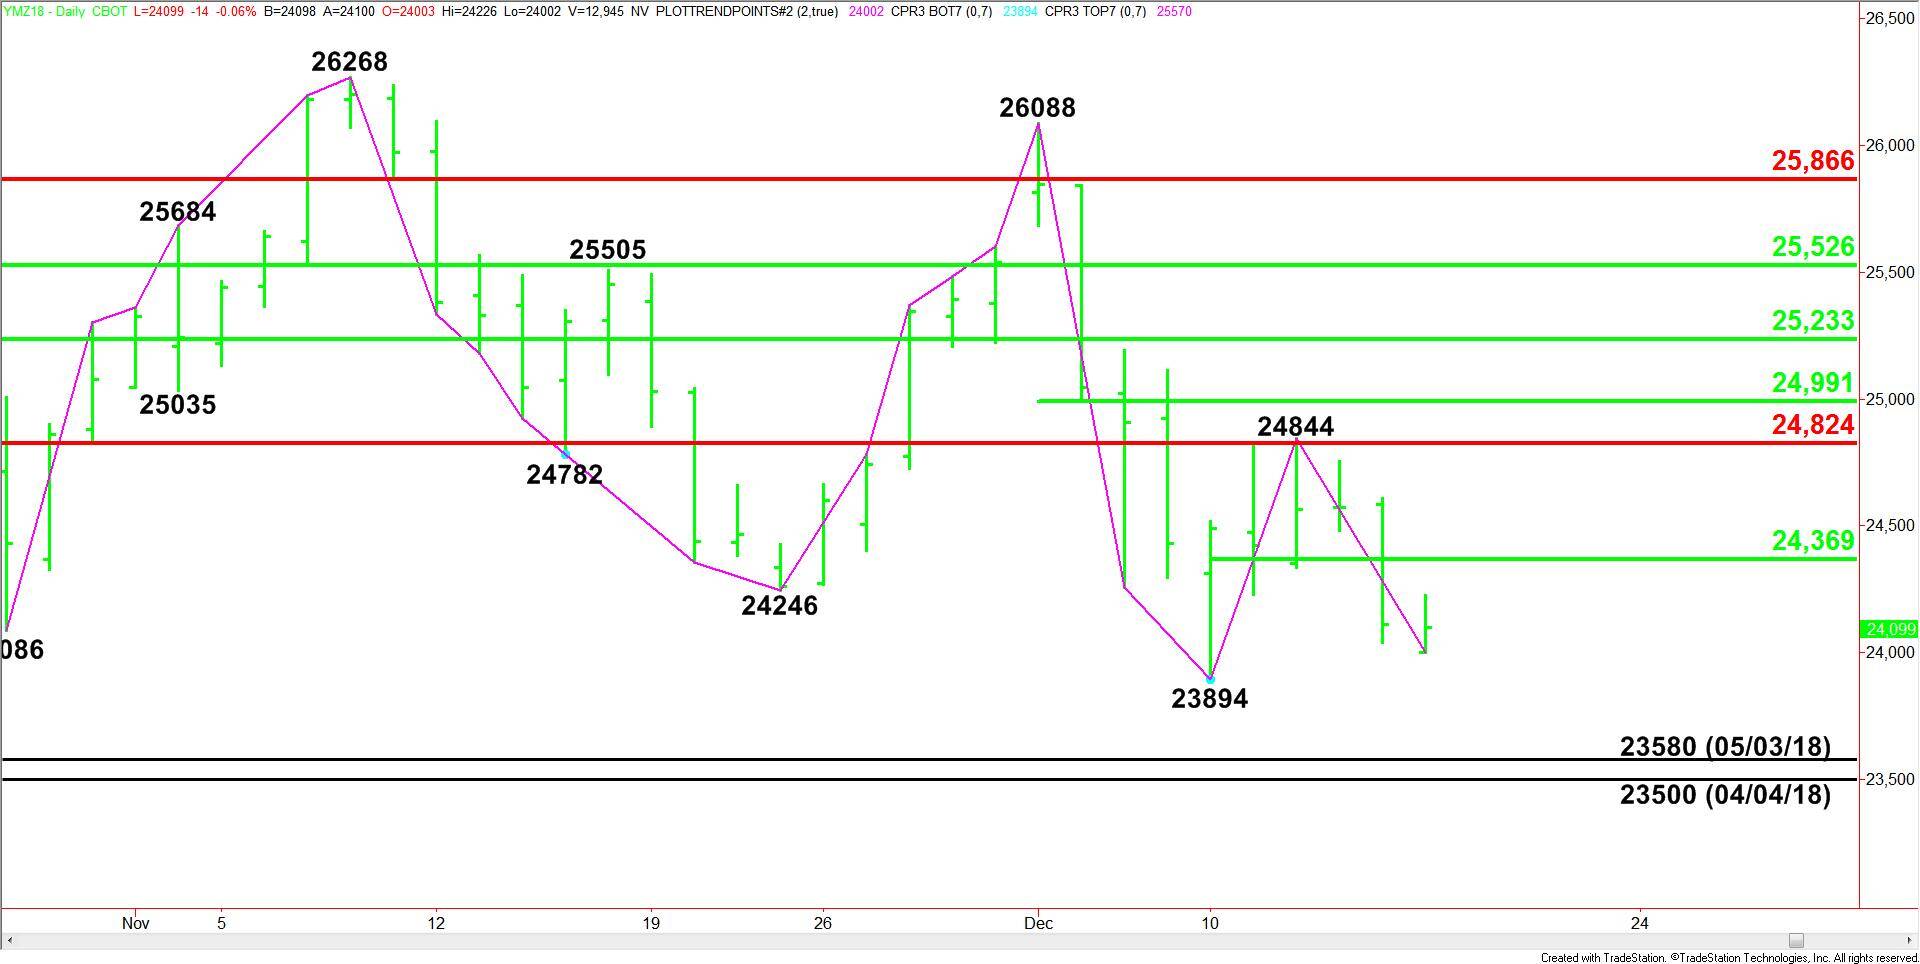
The main trend is down according to the daily swing chart. Today’s early weakness turned 24844 into a new main top. A trade through this top will change the main trend to up.
A move through 23894 will signal a resumption of the downtrend. If there is enough selling volume on the move then look for the weakness to extend into a pair of main bottoms at 23580 and 23500.00.
The short-term range is 23894 to 24844. Its 50% level or pivot at 24369 is the nearest resistance.
The next resistance is the major Fibonacci level at 24824.
The main range is 26088 to 23894. Its 50% level at 24991 is the next resistance level.
Daily Swing Chart Technical Forecast
The market is currently trading inside a range formed by a main bottom at 23894 and a pivot at 24369. Trader reaction to these levels will determine the direction of the December E-mini S&P 500 Index on Monday.
Bullish Scenario
Taking out the pivot at 24369 and sustaining the rally will indicate the return of buyers. If this move creates enough upside momentum, we could see an eventual rally into a resistance cluster at 24824 to 24844.
Bearish Scenario
The inability to overcome the pivot at 24369 will signal the presence of sellers. If this move creates enough downside momentum then look for the selling to extend into the main bottom at 23894. This is a potential trigger point for an acceleration into the pair of main bottoms at 23580 and 23500.
About the Author
James Hyerczykauthor
James is a Florida-based technical analyst, market researcher, educator and trader with 35+ years of experience. He is an expert in the area of patterns, price and time analysis as it applies to futures, Forex, and stocks.
Did you find this article useful?
Latest news and analysis


Advertisement