
Advertisement
Advertisement
E-mini S&P 500 Index (ES) Futures Technical Analysis – Pivot at 2634.75 Controlling Price Action
By:
The December E-mini S&P 500 Index is currently trading under the pivot at 2634.75 and above the main bottom at 2583.00. Trader reaction to these levels will likely determine the direction of the index on Monday.

December E-mini S&P 500 Index futures are inching higher Monday. Although the index traded below Friday’s low early in the session, there was very little follow-through to the downside and the market quickly turned positive. This may be an indication that traders are being cautious about selling weakness so close to the main bottom at 2583.00. It could also mean that aggressive counter-trend buyers are coming in to defend this bottom.
At 0847 GMT, December E-mini S&P 500 Index futures are trading 2603.50, up 1.50 or +0.06%.
Daily Swing Chart Technical Analysis
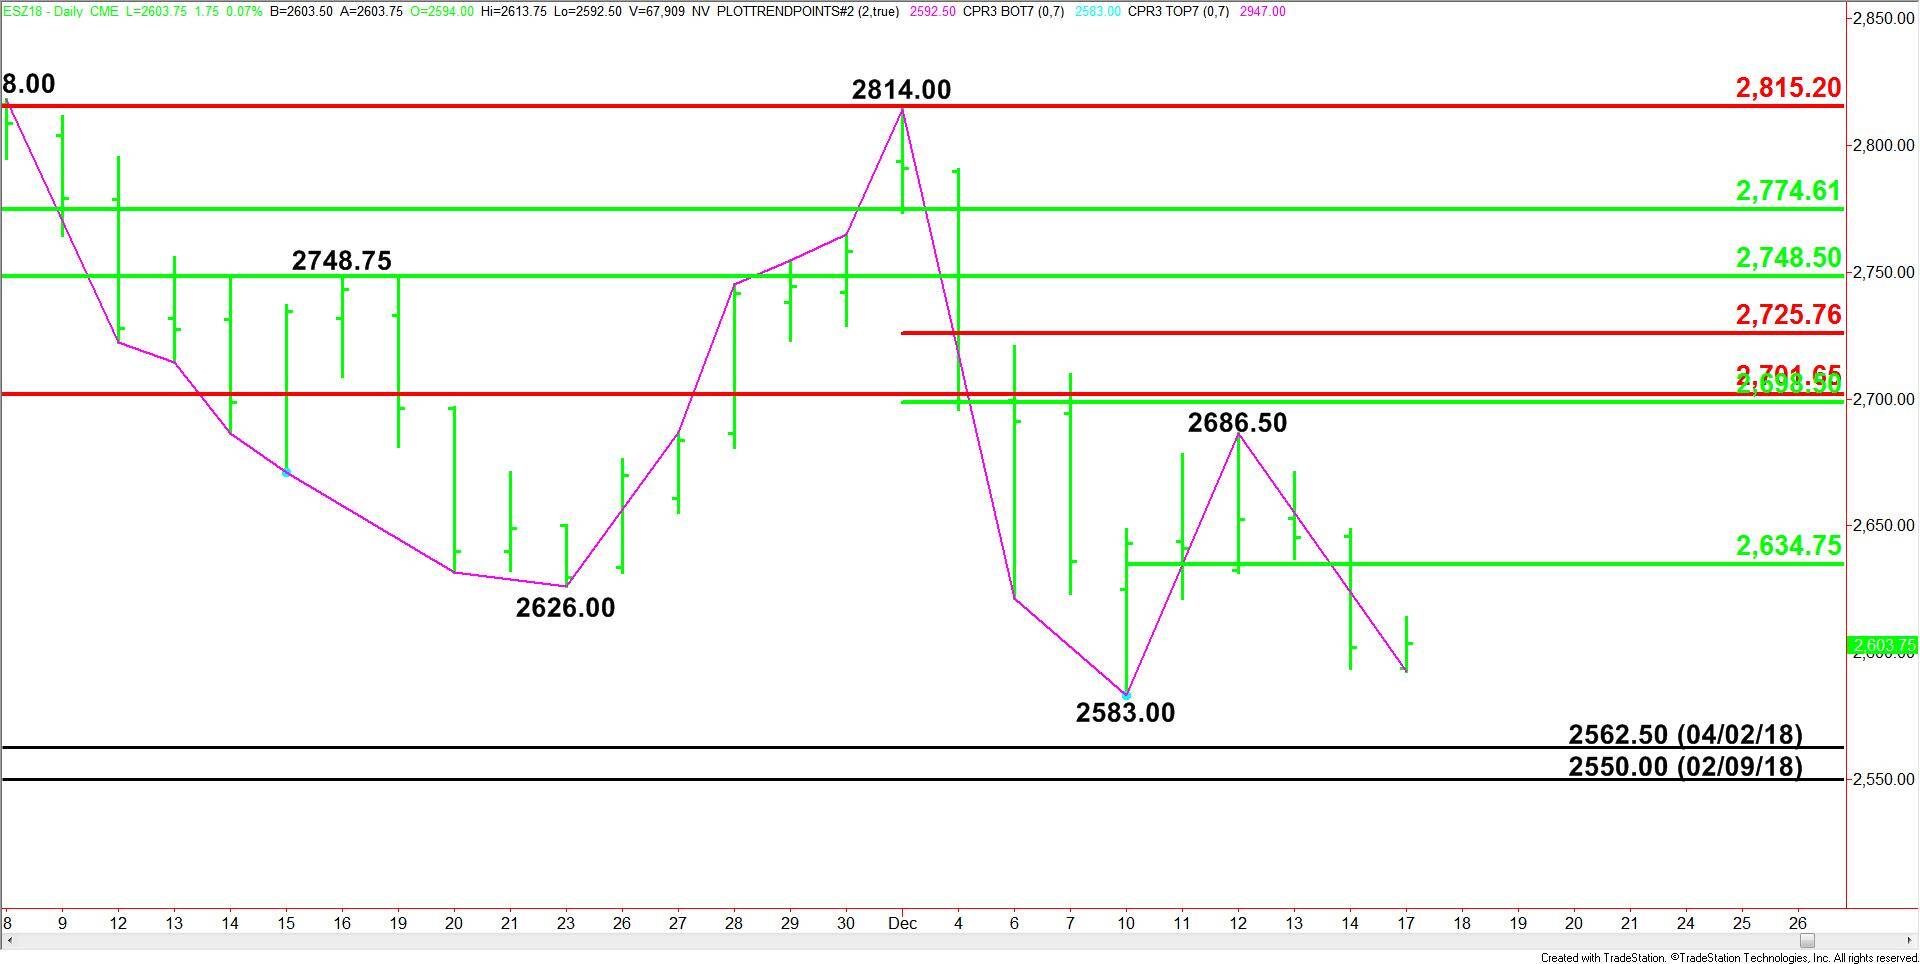
The main trend is down according to the daily swing chart. Today’s price action turned 2686.50 into a new main top. A trade through this top will change the main trend to up.
Taking out 2583.00 will negate a closing price reversal bottom from December 10. It will also reaffirm the downtrend with new targets coming in at 2562.50 and 2550.00.
The short-term range is 2583.00 to 2686.50. Its 50% level or pivot at 2634.75 is resistance.
The main range is 2814.00 to 2583.00. Its retracement zone at 2698.50 to 2725.75 is the next resistance area. Inside this zone is a long-term Fibonacci level at 2701.75.
Daily Swing Chart Technical Forecast
The December E-mini S&P 500 Index is currently trading under the pivot at 2634.75 and above the main bottom at 2583.00. Trader reaction to these levels will likely determine the direction of the index on Monday.
Since the main trend is down, we’re likely to see sellers show up on the first test of 2634.75. Overtaking this pivot, however, could trigger an acceleration to the upside with the next potential targets coming in at 2686.50, 2698.50 and 2701.75.
If 2634.75 remains resistance then new selling pressure could build. If this move creates enough downside momentum then look for a possible test of the main bottom at 2583.00, followed closely by a pair of longer-term main bottoms at 2562.50 and 2550.00.
About the Author
James Hyerczykauthor
James is a Florida-based technical analyst, market researcher, educator and trader with 35+ years of experience. He is an expert in the area of patterns, price and time analysis as it applies to futures, Forex, and stocks.
Did you find this article useful?
Latest news and analysis


Advertisement