


CAD Analysis and Talking Points
- USDCAD | Break of Support to Increase Scope Towards 1.32
- EURCAD | 200DMA Break Needed for Further Selling
- CADJPY | Sentiment Remains Negative Despite Paring Flash Crash Losses
See the DailyFX Q1 FX forecast to learn what will drive the currency throughout the quarter.
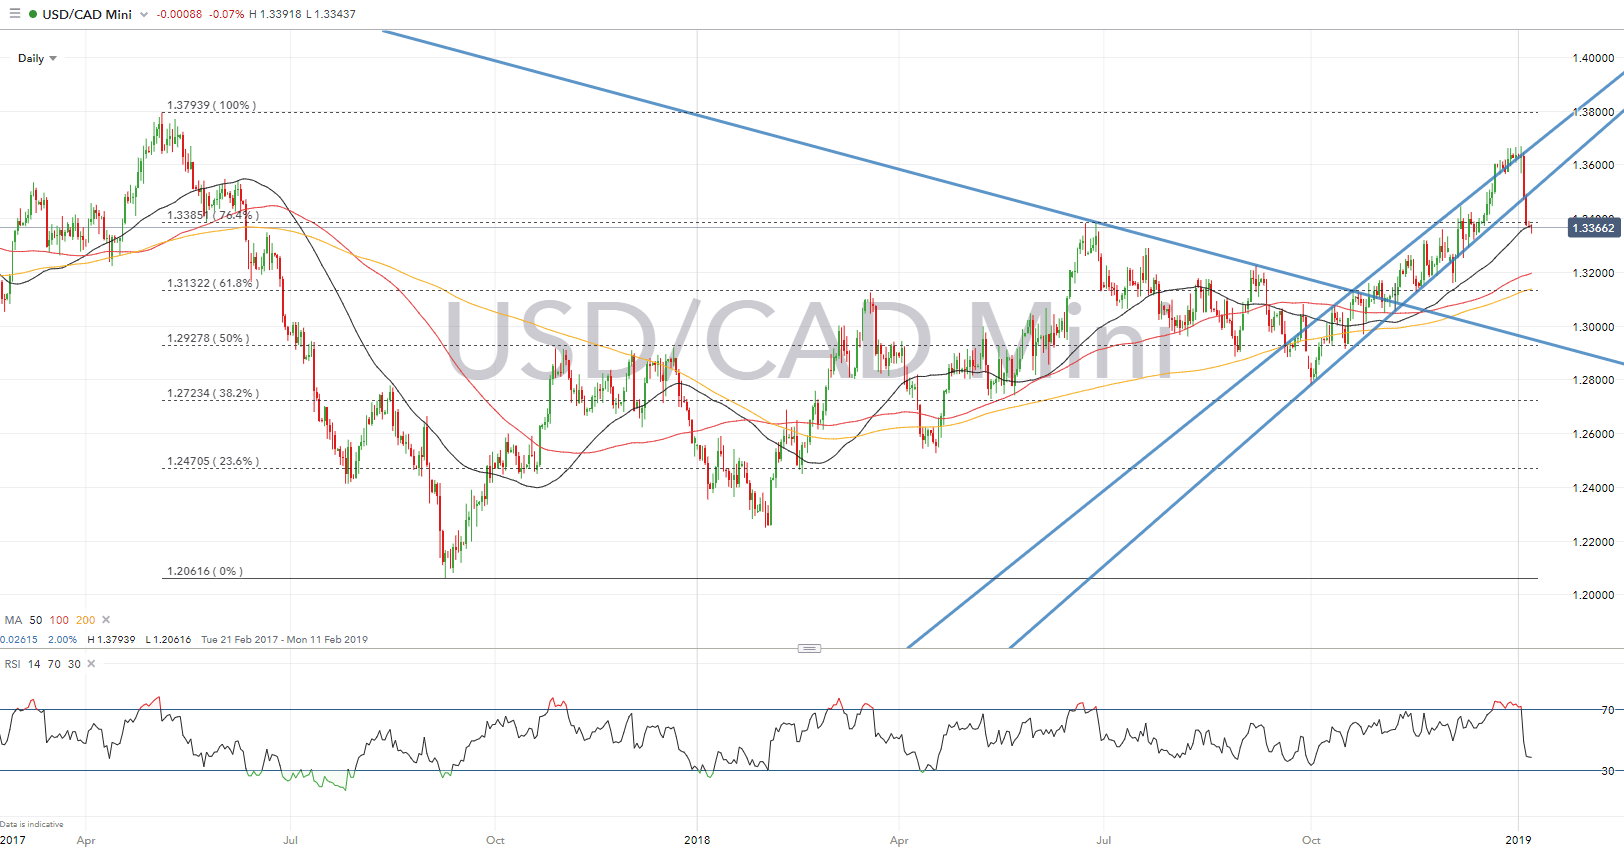
USDCAD | Break of Support to Increase Scope Towards 1.32
Last week saw a notable shift in sentiment for USDCAD, having broken out of the rising channel that has been in place since October. Consequently, momentum indicators point towards further downside. The pair are currently hovering around notable support levels with the 74.6% Fibonacci retracement at 1.3385, while the 50DMA resides at 1.3332. However, a break below increases scope for a test of the 1.32 handle.
USDCAD PRICE CHART: Daily Time Frame (Feb 2017 – Jan 2019)
EURCAD | 200DMA Break Needed for Further Selling
Following last week’s price action, in which EURCAD failed to maintain a foothold above 1.56, sentiment on pair has shifted. Momentum indicators signal further bearish price action, however, a break and close below the 200DMA at 1.5215 is needed to confirm. If indeed this is achieved, bears can eye a move towards the 23.6% Fibonacci Level sitting at 1.5090. Resistance is situated at 1.5290-1.5300, which is holding thus far.
EURCAD PRICE CHART: Daily Time Frame (Mar 2018– Jan 2019)

CADJPY | Sentiment Remains Negative Despite Paring Flash Crash Losses
Last week saw notable volatility and flash crash moves in major JPY crosses. However, while CADJPY has retraced those losses, momentum indicators remain tilted to the downside. As such, for a shift in sentiment a break above the 61.8% Fibonacci retracement level at 81.25 and the 82.00 handle would be needed.
CADJPY PRICE CHART: Daily Time Frame (Jul 2016– Jan 2019)

--- Written by Justin McQueen, Market Analyst
To contact Justin, email him at Justin.mcqueen@ig.com
Follow Justin on Twitter @JMcQueenFX


