- The Russian currency picks up extra pace to sub-67.00 levels.
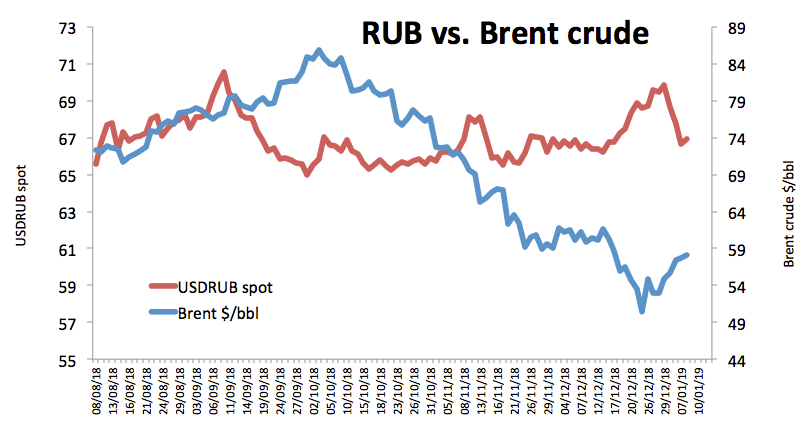
- Brent up move continues to sustain the demand for RUB.
- US-China trade talks spark a bout of generalized optimism.
The Russian Ruble is extending the rally so far this week and is now motivating USD/RUB to print multi-day lows in levels below the critical 67.00 the figure.
USD/RUB offered on oil advance
The continuation of the rally in crude oil prices is now lifting the barrel of Brent crude to fresh tops beyond the $58.00 milestone, giving extra support to the demand for the Russian currency and thus dragging spot to fresh 3-week lows.
Rising optimism over a positive outcome from the ongoing trade talks between the US and China in Beijing has been sustaining the broad-based upbeat sentiment in the risk-associated atmosphere.
In the US data universe, the NFIB index came in above estimates at 104.4 for the month of December while the more relevant JOLTs Job Openings dropped to 6.888 in November. Looking ahead, the American Petroleum Institute will publish its weekly report on US crude oil stockpiles later in the day.
What to look for around RUB
Brent dynamics should continue to be the main catalyst for the price action in the Ruble, while a close eye remains on the progress (or lack of it) of the US-China trade dispute (or potential agreement). In addition, the central bank will closely follow the performance of consumer prices and inflation expectations, where the CPI is seen edging higher during H2 to slowly converge towards the CBR’s target at 4.0% by year-end. The main risk facing RUB is the likeliness of further US sanctions against Russian citizens/companies or the domestic energy sector, which should seriously damage investor sentiment.
USD/RUB levels to watch
At the moment the pair is losing 1.20% at 66.92 and a break below 66.84 (55-day SMA) would aim for 65.43 (low Nov.22 2018) and finally 64.85 (low Oct.1 2018). On the flip side, the initial hurdle aligns at 67.74 (21-day SMA) seconded by 68.71 (10-day SMA) and then 69.94 (high Dec.29 2018).
Information on these pages contains forward-looking statements that involve risks and uncertainties. Markets and instruments profiled on this page are for informational purposes only and should not in any way come across as a recommendation to buy or sell in these assets. You should do your own thorough research before making any investment decisions. FXStreet does not in any way guarantee that this information is free from mistakes, errors, or material misstatements. It also does not guarantee that this information is of a timely nature. Investing in Open Markets involves a great deal of risk, including the loss of all or a portion of your investment, as well as emotional distress. All risks, losses and costs associated with investing, including total loss of principal, are your responsibility. The views and opinions expressed in this article are those of the authors and do not necessarily reflect the official policy or position of FXStreet nor its advertisers. The author will not be held responsible for information that is found at the end of links posted on this page.
If not otherwise explicitly mentioned in the body of the article, at the time of writing, the author has no position in any stock mentioned in this article and no business relationship with any company mentioned. The author has not received compensation for writing this article, other than from FXStreet.
FXStreet and the author do not provide personalized recommendations. The author makes no representations as to the accuracy, completeness, or suitability of this information. FXStreet and the author will not be liable for any errors, omissions or any losses, injuries or damages arising from this information and its display or use. Errors and omissions excepted.
The author and FXStreet are not registered investment advisors and nothing in this article is intended to be investment advice.
Recommended content
Editors’ Picks
AUD/USD defends 0.6400 after Chinese data dump

AUD/USD has found fresh buyers near 0.6400, hanging near YTD lows after strong China's Q1 GDP data. However, the further upside appears elusive amid weak Chinese activity data and sustained US Dollar demand. Focus shifts to US data, Fedspeak.
USD/JPY stands tall near multi-decade high near 154.50

USD/JPY keeps its range near multi-decade highs of 154.45 in the Asian session on Tuesday. The hawkish Fed expectations overshadow the BoJ's uncertain rate outlook and underpin the US Dollar at the Japanese Yen's expense. The pair stands resilient to the Japanese verbal intervention.
Gold: Buyers take a breather below $2,400 amid easing geopolitical tensions

Gold price is catching a breath below $2,400 in Asian trading on Tuesday, having risen over 1% in the US last session even on a solid US Retail Sales report, which powered the US Dollar through the roof. Easing Middle East geopolitical tensions and strong Chinese data could cap Gold's upside.
SOL primed for a breakout as it completes a rounding bottom pattern

Solana price has conformed to the broader market crash, following in the steps of Bitcoin price that remains in the red below the $65,000 threshold. For SOL, however, the sensational altcoin could have a big move in store.
Israel-Iran military conflict views and takeaways

Iran's retaliatory strike on Israel is an escalation of Middle East tensions, but not necessarily a pre-cursor to broader regional conflict. Events over the past few weeks in the Middle East, more specifically this past weekend, reinforce that the global geopolitical landscape remains tense.