


ASEAN Technical Outlook – USD/PHP, USD/SGD, USD/IDR, USD/MYR
- Gains in the Indonesian Rupiah, Malaysian Ringgit and Philippine Peso slowed
- USD/MYR and USD/PHP may be readying to turn higher as US Dollar climbs
- USD/SGD remains in a downtrend and USD/IDR entered consolidation mode
We released our Q1 forecasts for currencies like the US Dollar in the DailyFX Trading Guides page
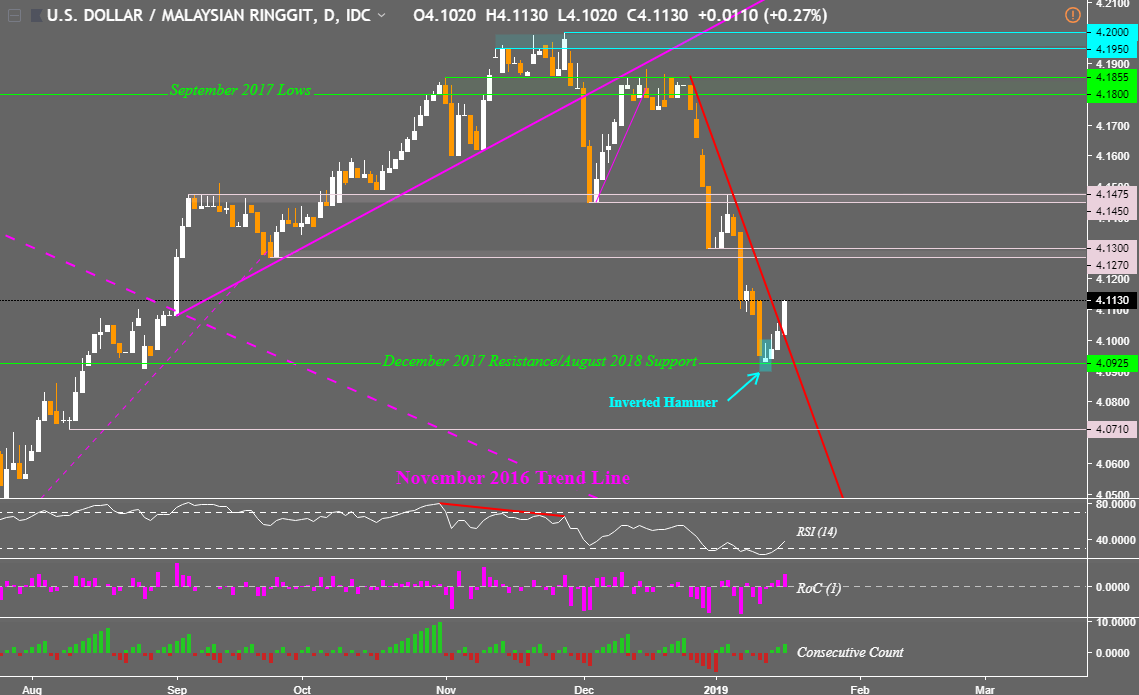
USD/MYR Technical Analysis – Entering New Dominant Uptrend?
The US Dollar may be readying to appreciate against the Malaysian Ringgit in the days ahead. On the USD/MYR daily chart below, the pair bottomed right on the December 2017 resistance/August 2018 support line at 4.0925. This created an Inverted Hammer candlestick which warned that a turn higher might have been in the cards. What followed was confirmation via more closes to the upside.
USD/MYR rose above the near-term descending resistance line from late December. Closing above it may lead to a new dominant uptrend. Immediately in the way as resistance is a range in-between 4.1270 and 4.1300 before exposing 4.1450 – 4.1475. Meanwhile a turn lower and a close under 4.0925 would open the door to testing the August 9th, 2018 low at 4.0710.
USD/MYR Daily Chart
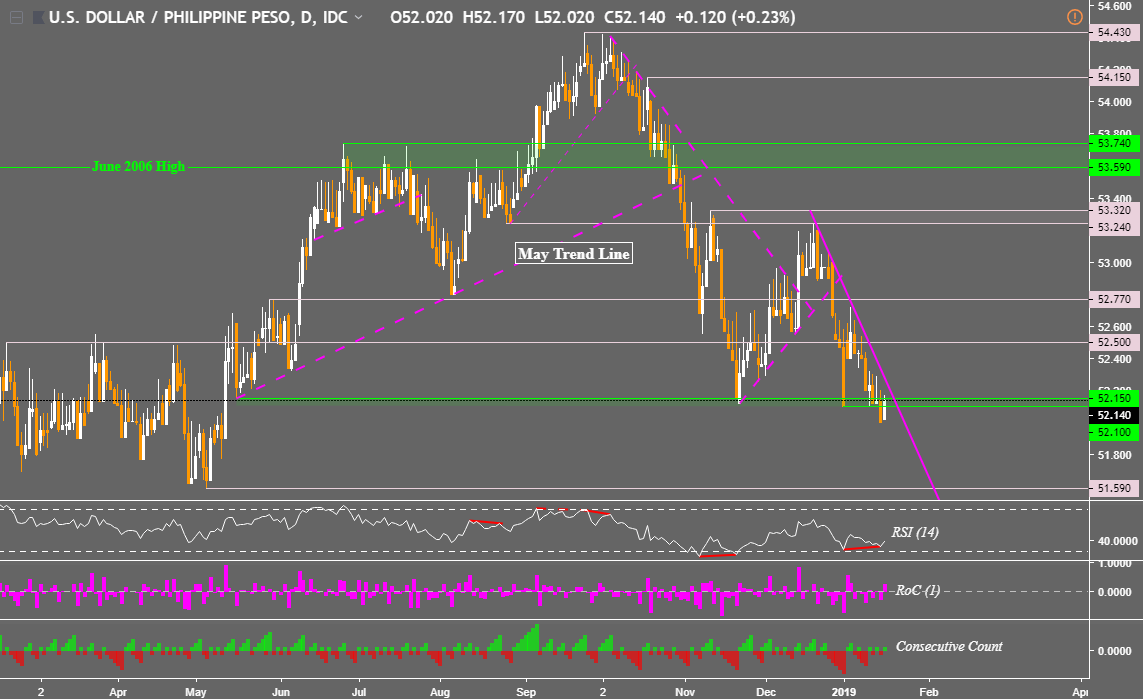
USD/PHP Technical Analysis – Downtrend at Risk?
After breaching the outer boundaries of near-term support at 52.10, USD/PHP appears to be on the verge of closing back above it in a false breakout. Simultaneously, positive RSI divergence warns that downside momentum is fading and this may precede a reversal as it did back in November 2018. Though past performance is not indicative of future results.
For a new uptrend, I would watch to see if the descending trend line from mid December 2018 holds. A climb above it may lead to more gains down the road. In that case, resistance after that appears to be 52.50 followed by 52.77. For updates on the ASEAN pairs I am closely watching, you may follow me on Twitter @ddubrovskyFX for more immediate updates.
USD/PHP Daily Chart
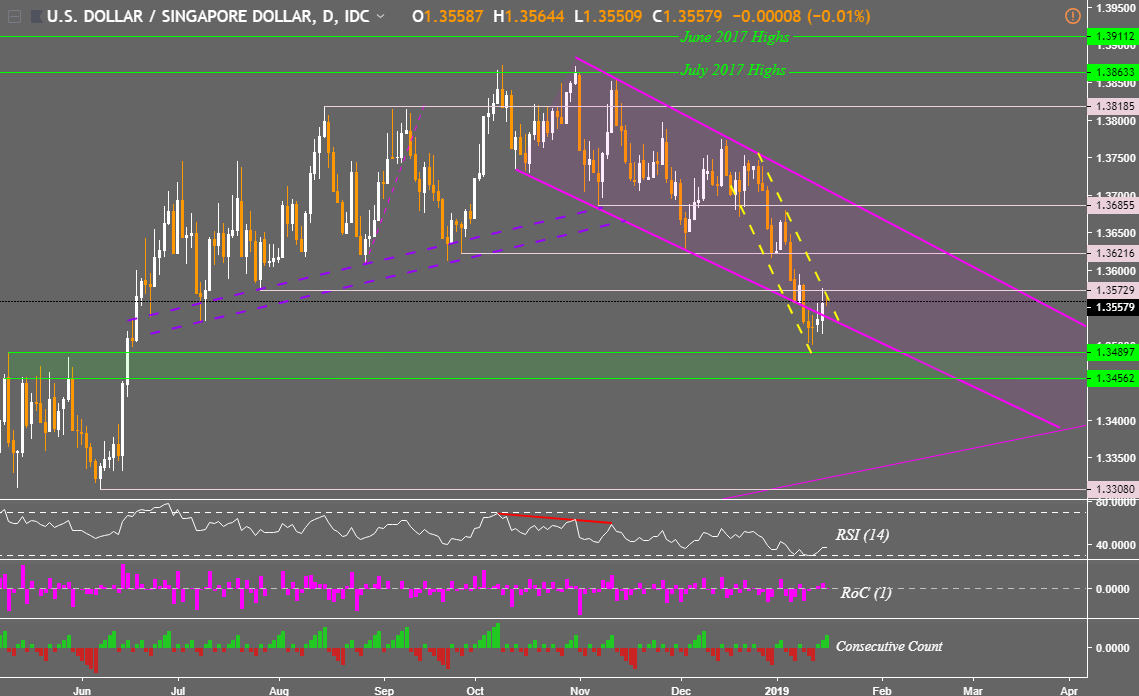
USD/SGD Technical Analysis – Downtrend Within a Downtrend
The Singapore Dollar is back in its descending channel from October 2018 against its US counterpart after a false breakout to the downside. However, it is still within the boundaries of a steeper descending channel (dashed yellow lines on the USD/SGD chart below) inside the larger one. As such, the downtrend is still intact as prices sit right under resistance at 1.35729. Extending the pair’s decline still requires closing under a horizontal range of support between 1.34897 and 1.345625.
USD/SGD Daily Chart
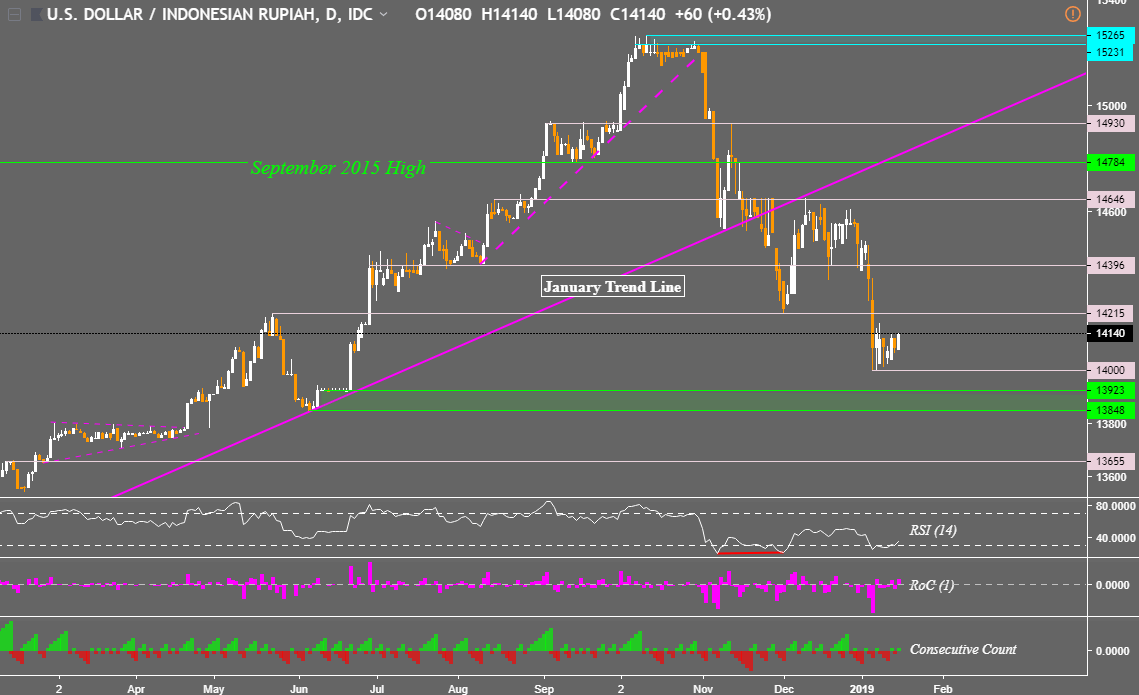
USD/IDR Technical Analysis – Consolidation Mode
USD/IDR remained in consolidation mode after accelerating the dominant downtrend last week. Near-term support is at 14,000 while a push above 14,215 may open the door to testing 14,396 next.
USD/IDR Daily Chart
**All Charts Created in TradingView
Read this week’s ASEAN fundamental outlook to learn about the underlying drivers for these currencies!
FX Trading Resources
- Just getting started? See our beginners’ guide for FX traders
- Having trouble with your strategy? Here’s the #1 mistake that traders make
- See how the US Dollar is viewed by the trading community at the DailyFX Sentiment Page
--- Written by Daniel Dubrovsky, Junior Currency Analyst for DailyFX.com
To contact Daniel, use the comments section below or @ddubrovskyFX on Twitter


