


S&P 500/Dow Jones/Nasdaq 100 Technical Highlights:
- S&P 500 continues to drive into resistance
- Dow Jones should find sellers over 24k
- Nasdaq 100 near trend-line off record high
Q1 Forecasts are out! Check out the Trading Guides page for these and other guides to help you get off to a good start to 2019.
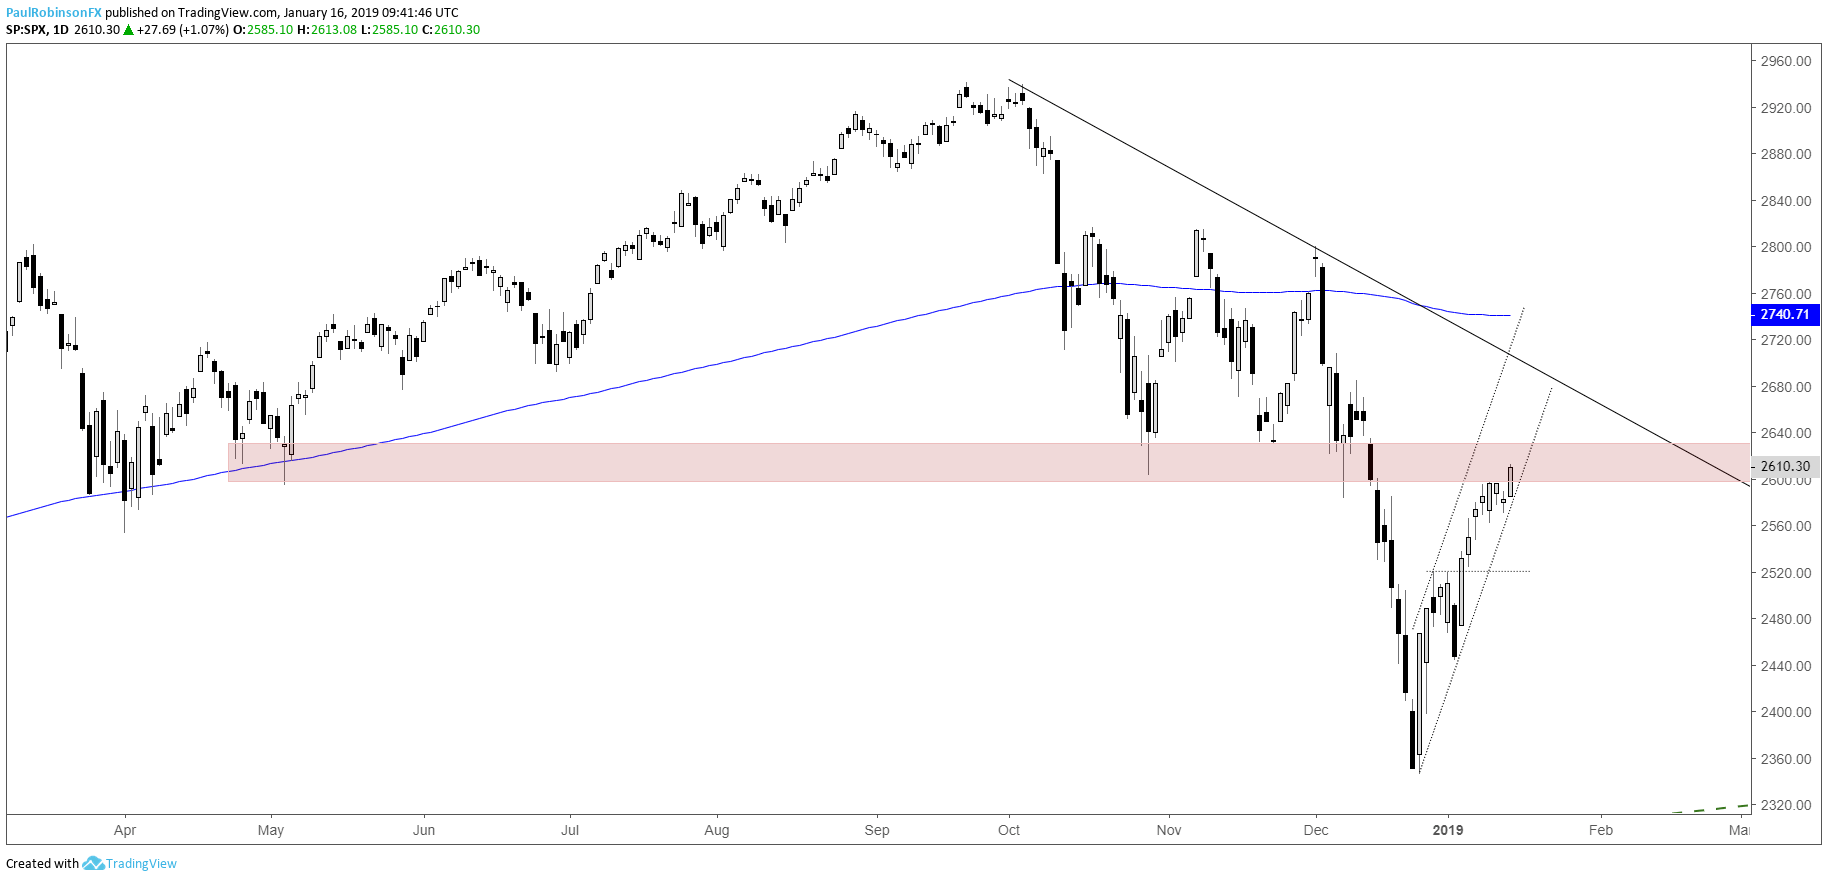
S&P 500 continues to drive into resistance
The S&P 500 meandered sideways for a few sessions prior to another push higher yesterday. The index continues to hold well with no real signs of abating, but as the rise continues further into resistance the risk of a reversal climbs. A test of the reversal off the December lows will be a normal event even if the market is to push yet higher still.
The game-plan remains to wait for buying to dry up and see a bit of selling pressure before looking to take a stab from the short-side. Selling blindly into a one-way rally or buying blindly into a down-move can prove painful even if it yields results later.
With global stock market volatility high, see where our analysts see stocks headed in the Q1 Global Equities Forecast.
S&P 500 Daily Chart (Watching for signs of a turn)
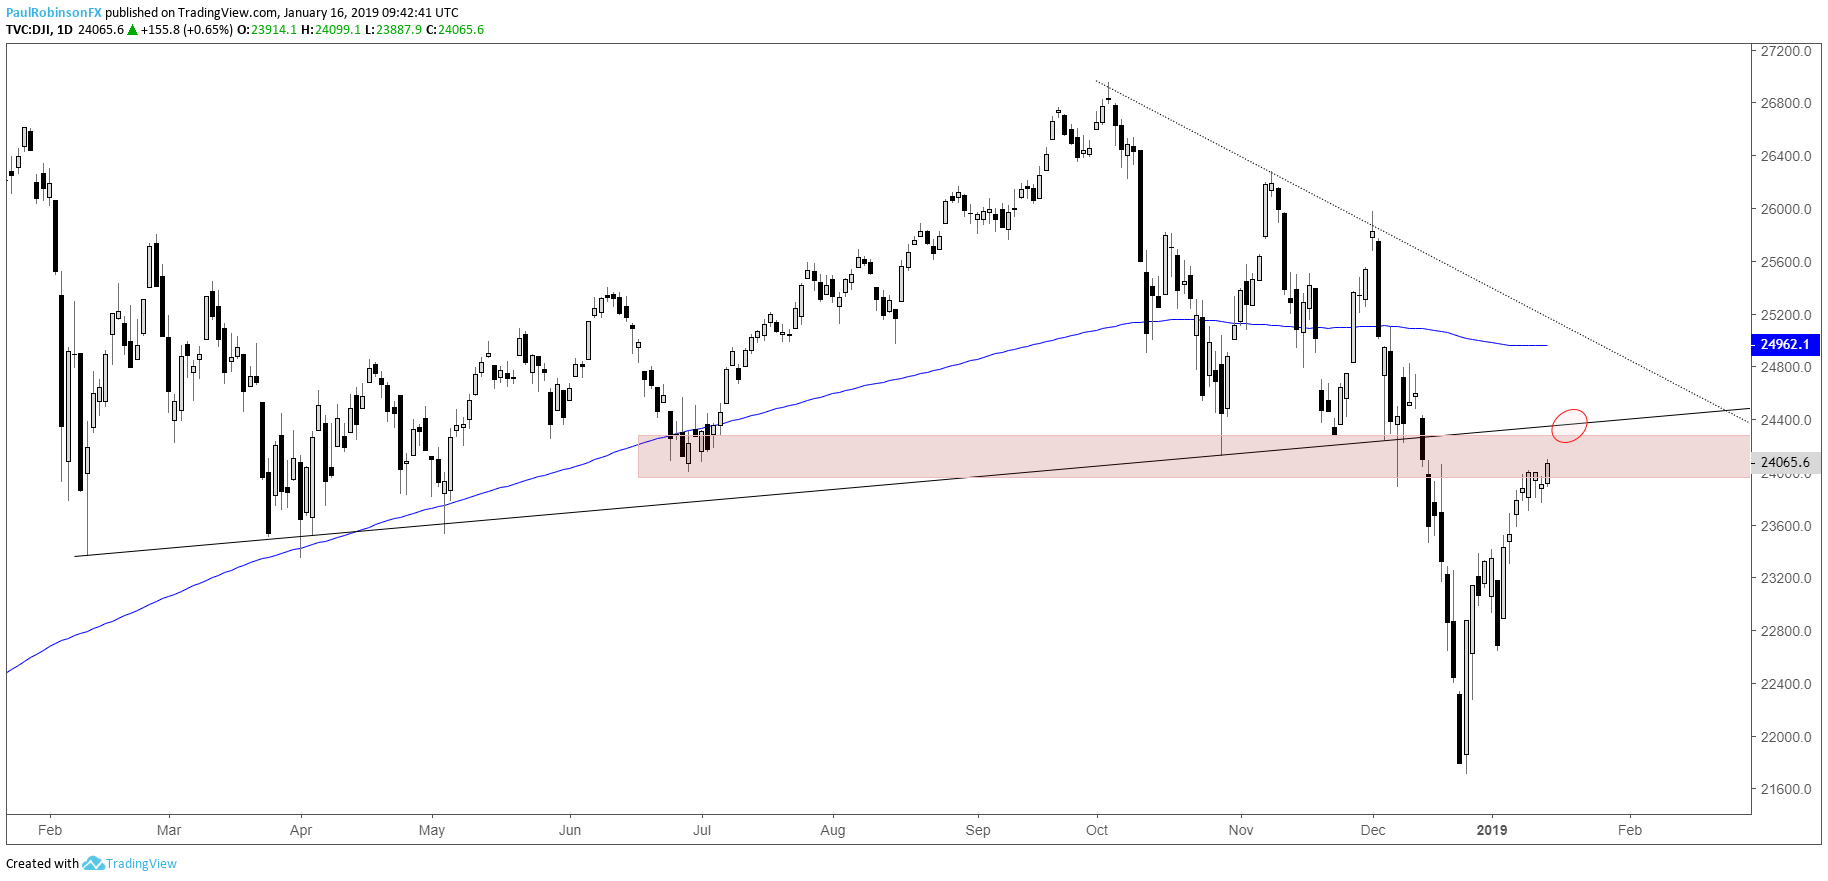
Dow Jones should find sellers over 24k
The Dow continues to forge on into resistance, with price levels over 24k coming up as the next points of resistance. There is a low-level trend-line from January 2018 which runs across near 24350. Once a meaningful shift in downward momentum develops the trading bias will turn from neutral to bullish towards taking advantage of weakness.
Dow Jones Daily Chart (Resistance over 24k)
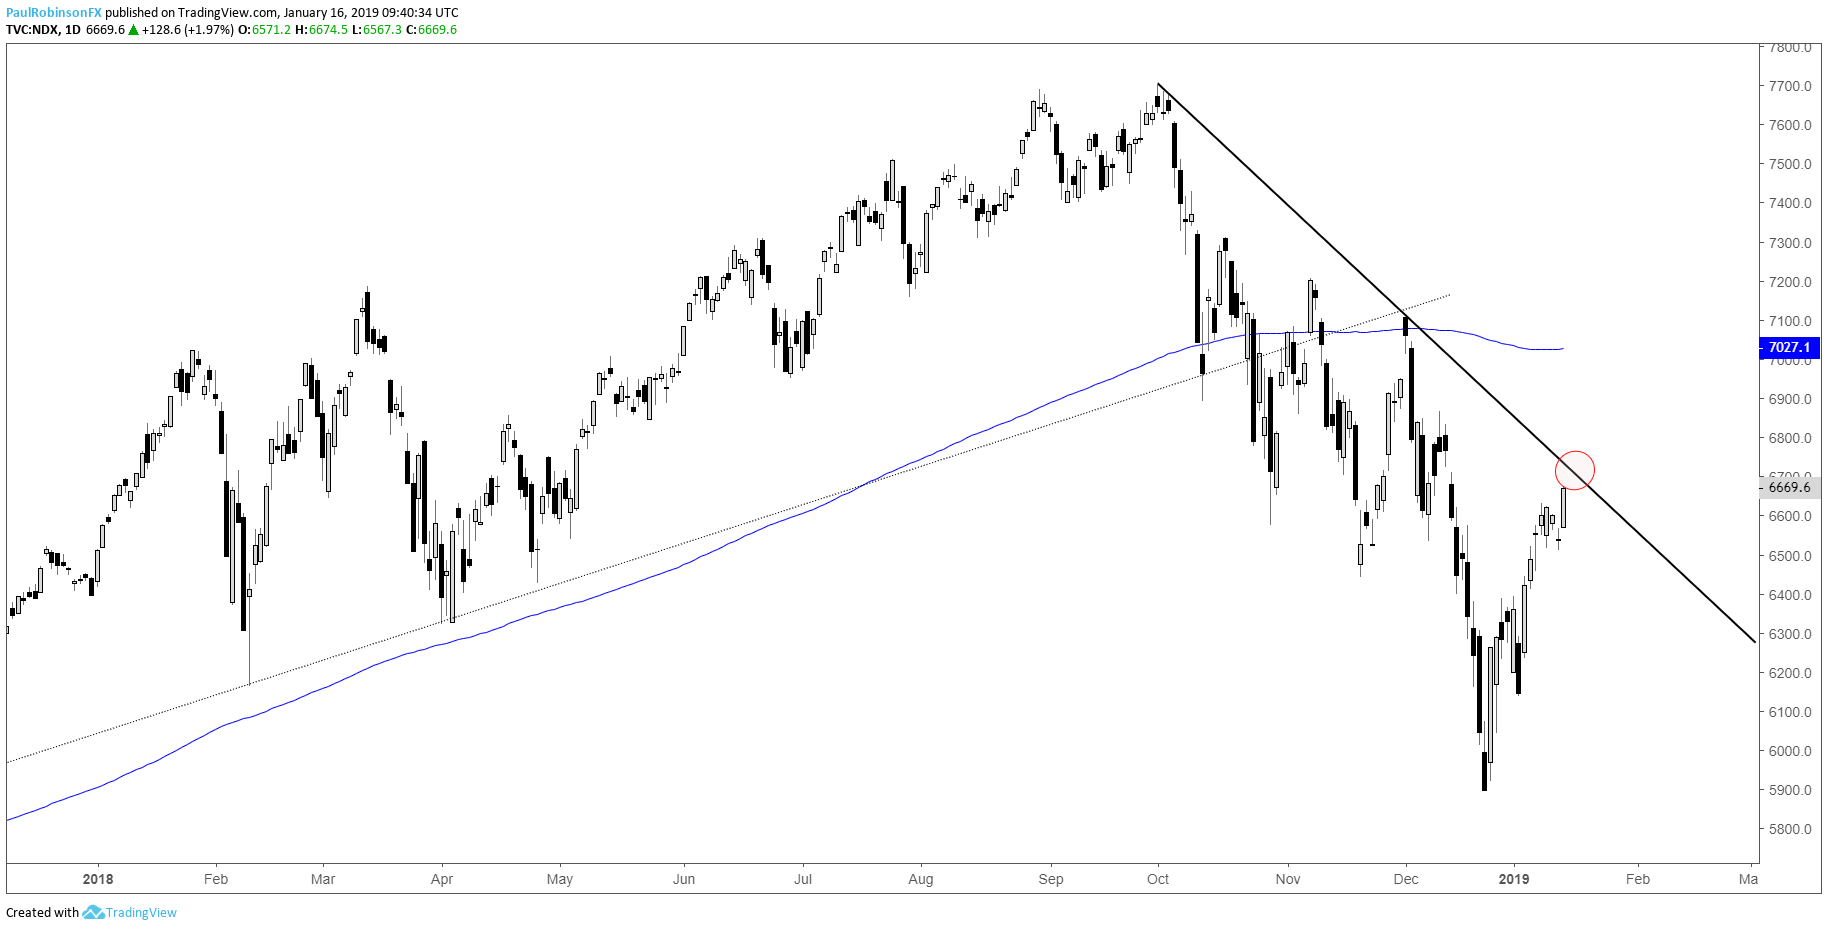
Nasdaq 100 near trend-line off record high
The Nasdaq 100 is very near the trend-line running lower off the record high, and after the strong bounce it’s had it should nearly out of fuel to keep propelling higher. Watch price action on a touch of the trend-line, it could happen as soon as today with it so close.
The Nasdaq 100 is an important index given the extremely heavy weighting of the bull market leaders known as FAANG (Facebook, Apple, Amazon, Netflix, and Google). So goes FAANG, goes the Nasdaq 100, goes the whole market.
Nasdaq 100 Daily Chart (T-line off record high)
To learn more about U.S. indices, check out “The Difference between Dow, Nasdaq, and S&P 500: Major Facts & Opportunities.” You can join me every Wednesday at 10 GMT for live analysis on equity indices and commodities, and for the remaining roster of live events, check out the webinar calendar.
Tools for Forex & CFD Traders
Whether you are a beginning or experienced trader, DailyFX has several resources available to help you; indicator for tracking trader sentiment, quarterly trading forecasts, analytical and educational webinars held daily, trading guides to help you improve trading performance, and one specifically for those who are new to forex.
---Written by Paul Robinson, Market Analyst
You can follow Paul on Twitter at @PaulRobinsonFX


