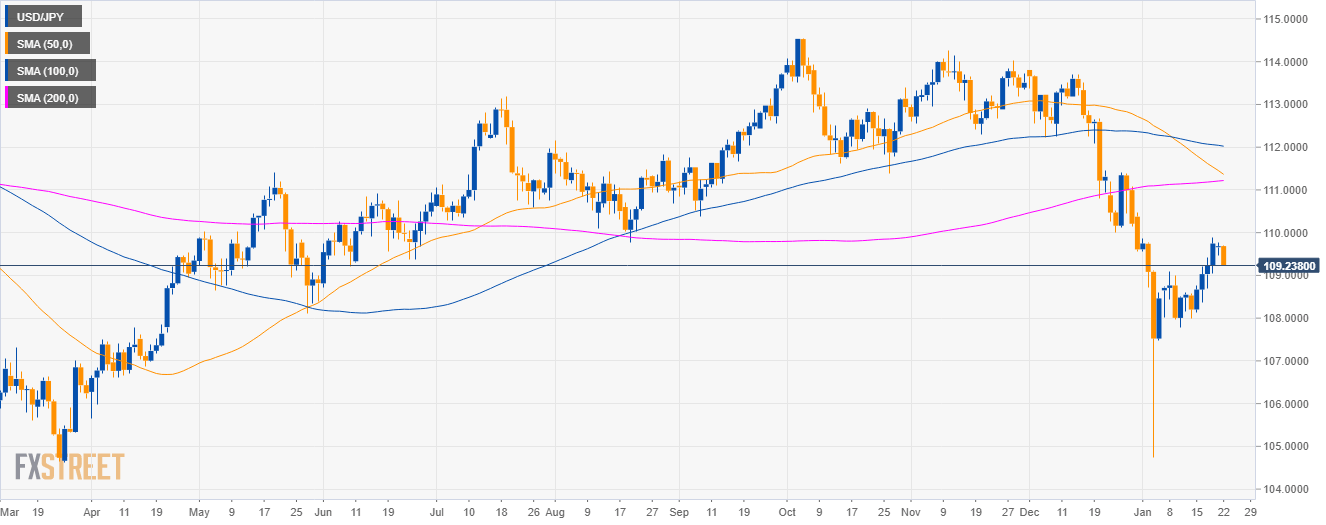
USD/JPY daily chart
- USD/JPY is trading in a deep pullback below the 50, 100 and 200-day simple moving averages (SMAs).
- As forecast, USD/JPY retraced to the 109.40 target.
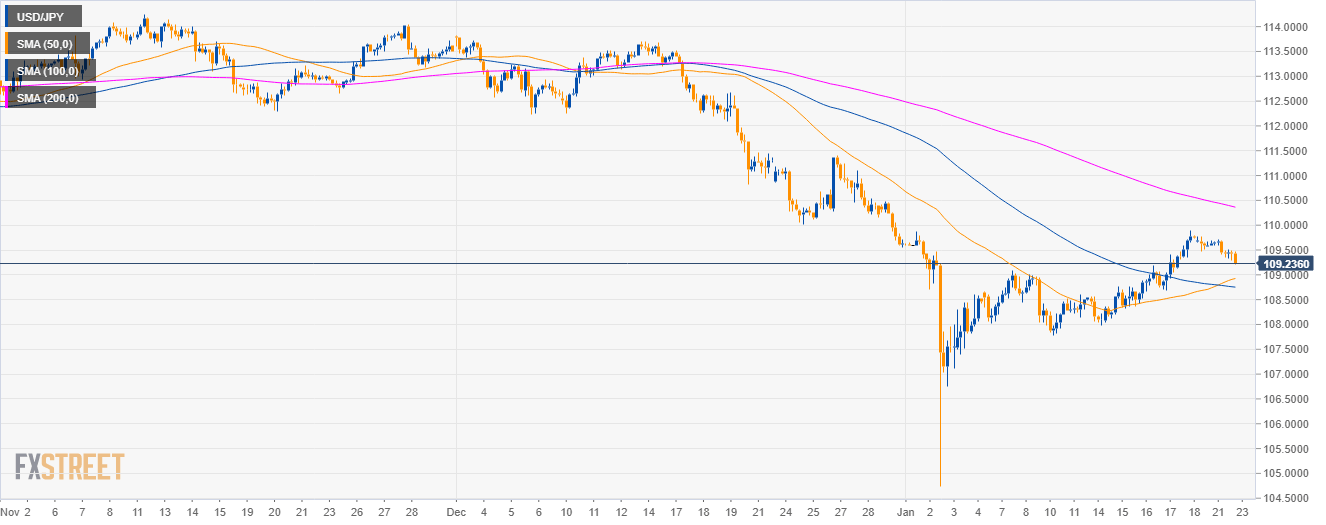
USD/JPY 4-hour chart
- USD/JPY is trading below its main 200 SMA.
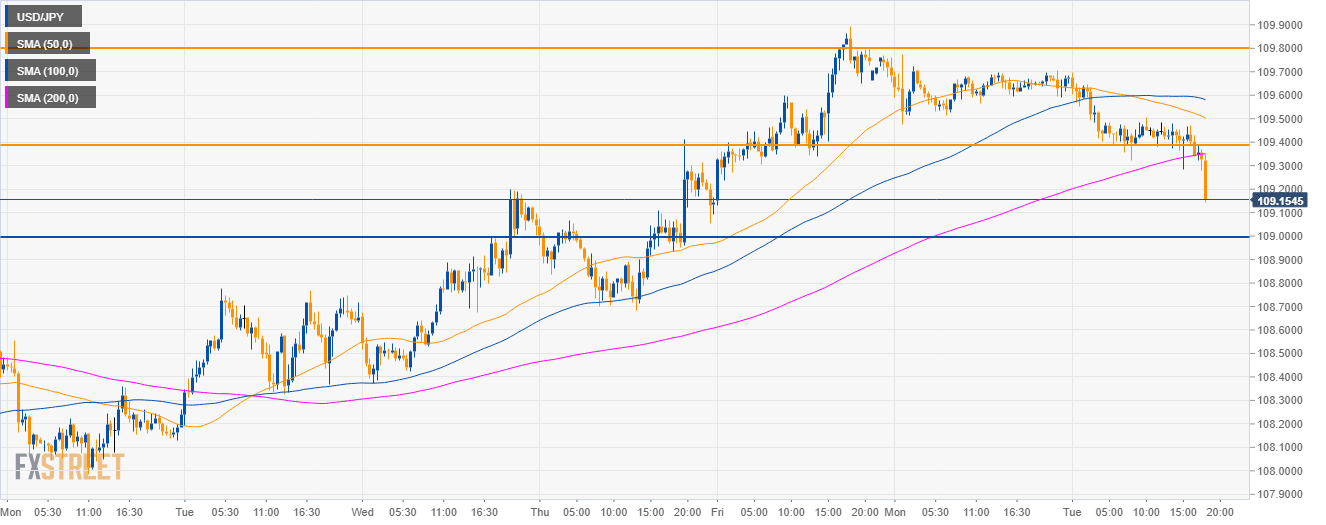
USD/JPY 30-minute chart
- As bears broke below the 109.40 support and the 200 SMA, USD/JPY is set to continue the decline to the 109.00 figure.
Additional key levels
USD/JPY
Overview:
Today Last Price: 109.18
Today Daily change: -0.50 pips
Today Daily change %: -0.46%
Today Daily Open: 109.68
Trends:
Daily SMA20: 109.21
Daily SMA50: 111.45
Daily SMA100: 112.05
Daily SMA200: 111.2
Levels:
Previous Daily High: 109.78
Previous Daily Low: 109.47
Previous Weekly High: 109.9
Previous Weekly Low: 107.99
Previous Monthly High: 113.83
Previous Monthly Low: 109.55
Daily Fibonacci 38.2%: 109.66
Daily Fibonacci 61.8%: 109.59
Daily Pivot Point S1: 109.51
Daily Pivot Point S2: 109.34
Daily Pivot Point S3: 109.21
Daily Pivot Point R1: 109.81
Daily Pivot Point R2: 109.94
Daily Pivot Point R3: 110.11
Note: All information on this page is subject to change. The use of this website constitutes acceptance of our user agreement. Please read our privacy policy and legal disclaimer. Opinions expressed at FXstreet.com are those of the individual authors and do not necessarily represent the opinion of FXstreet.com or its management. Risk Disclosure: Trading foreign exchange on margin carries a high level of risk, and may not be suitable for all investors. The high degree of leverage can work against you as well as for you. Before deciding to invest in foreign exchange you should carefully consider your investment objectives, level of experience, and risk appetite. The possibility exists that you could sustain a loss of some or all of your initial investment and therefore you should not invest money that you cannot afford to lose. You should be aware of all the risks associated with foreign exchange trading, and seek advice from an independent financial advisor if you have any doubts.
Recommended content
Editors’ Picks
EUR/USD clings to daily gains above 1.0650

EUR/USD gained traction and turned positive on the day above 1.0650. The improvement seen in risk mood following the earlier flight to safety weighs on the US Dollar ahead of the weekend and helps the pair push higher.
GBP/USD recovers toward 1.2450 after UK Retail Sales data

GBP/USD reversed its direction and advanced to the 1.2450 area after touching a fresh multi-month low below 1.2400 in the Asian session. The positive shift seen in risk mood on easing fears over a deepening Iran-Israel conflict supports the pair.
Gold holds steady at around $2,380 following earlier spike

Gold stabilized near $2,380 after spiking above $2,400 with the immediate reaction to reports of Israel striking Iran. Meanwhile, the pullback seen in the US Treasury bond yields helps XAU/USD hold its ground.
Bitcoin Weekly Forecast: BTC post-halving rally could be partially priced in Premium

Bitcoin price shows no signs of directional bias while it holds above $60,000. The fourth BTC halving is partially priced in, according to Deutsche Bank’s research.
Week ahead – US GDP and BoJ decision on top of next week’s agenda

US GDP, core PCE and PMIs the next tests for the Dollar. Investors await BoJ for guidance about next rate hike. EU and UK PMIs, as well as Australian CPIs also on tap.