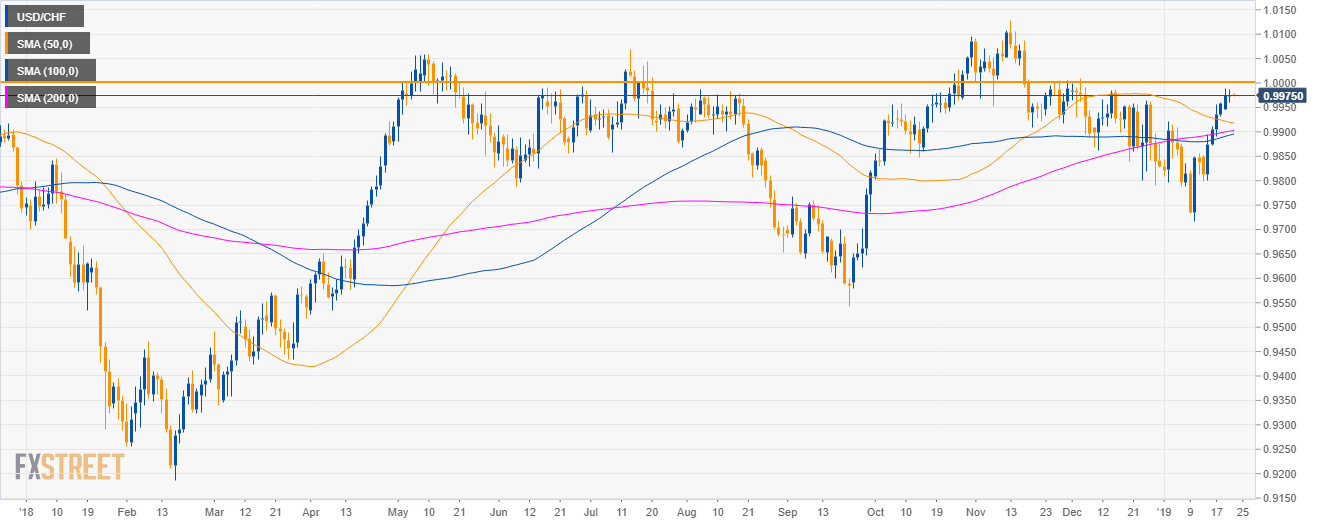
USD/CHF daily chart
- USD/CHF is trading in a bullish leg above the main simple moving averages (SMAs).
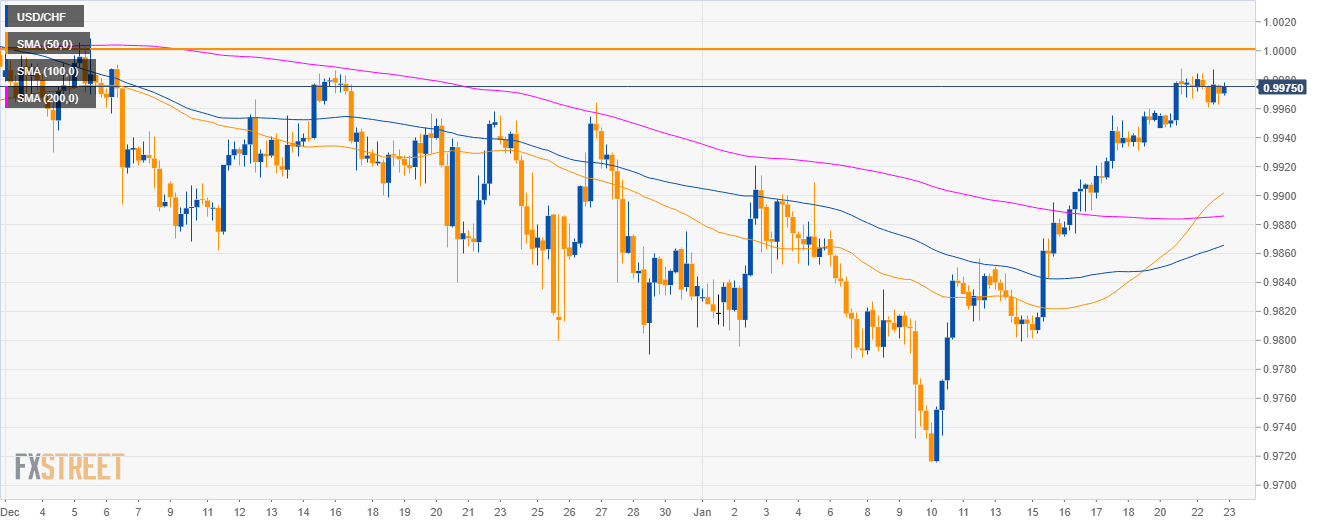
USD/CHF 4-hour chart
- USD/CHF is trading above the main SMAs as the market is trading just below the parity level.
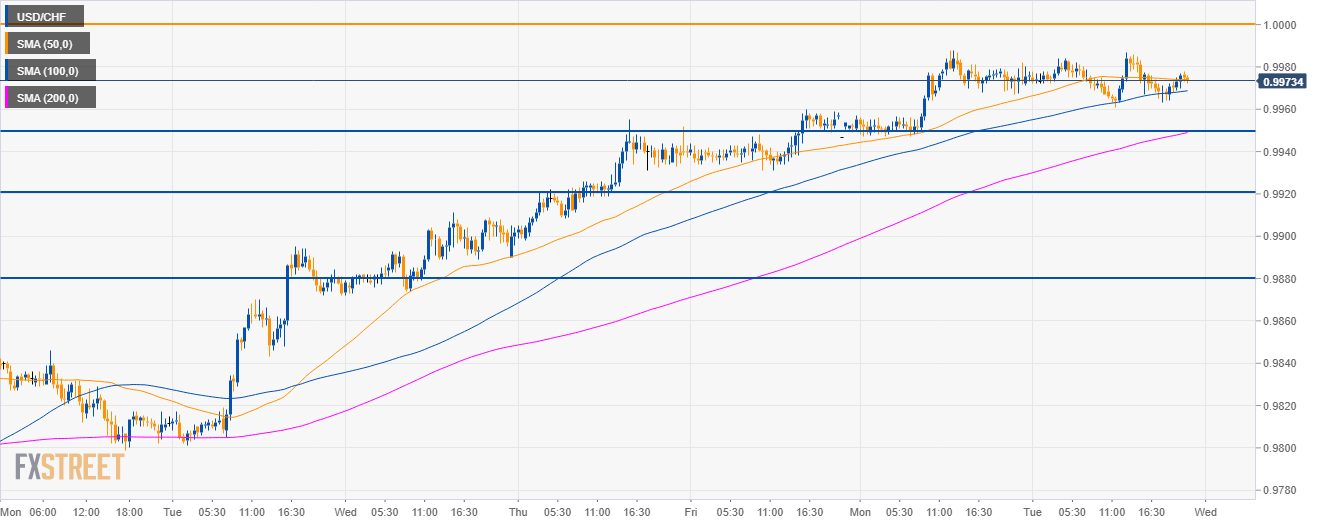
USD/CHF 30-minute chart
- This is a make-or-break situation for both bulls and bears as bulls would need a break above the parity level to extend the bull trend.
- A break above 1.0000 would lead to an acceleration to the 1.0030 level.
- On the flip side, failure to break above 1.0000 would trigger bears to target the 0.9950, 0.9920 and 0.9880 levels.
Additional key levels
NZD/USD
Overview:
Today Last Price: 0.6722
Today Daily change: - 7 pips
Today Daily change %: -0.10%
Today Daily Open: 0.6729
Trends:
Daily SMA20: 0.6747
Daily SMA50: 0.6797
Daily SMA100: 0.6689
Daily SMA200: 0.678
Levels:
Previous Daily High: 0.6756
Previous Daily Low: 0.6713
Previous Weekly High: 0.685
Previous Weekly Low: 0.6727
Previous Monthly High: 0.697
Previous Monthly Low: 0.6686
Daily Fibonacci 38.2%: 0.6729
Daily Fibonacci 61.8%: 0.674
Daily Pivot Point S1: 0.6709
Daily Pivot Point S2: 0.669
Daily Pivot Point S3: 0.6666
Daily Pivot Point R1: 0.6752
Daily Pivot Point R2: 0.6775
Daily Pivot Point R3: 0.6795
Note: All information on this page is subject to change. The use of this website constitutes acceptance of our user agreement. Please read our privacy policy and legal disclaimer. Opinions expressed at FXstreet.com are those of the individual authors and do not necessarily represent the opinion of FXstreet.com or its management. Risk Disclosure: Trading foreign exchange on margin carries a high level of risk, and may not be suitable for all investors. The high degree of leverage can work against you as well as for you. Before deciding to invest in foreign exchange you should carefully consider your investment objectives, level of experience, and risk appetite. The possibility exists that you could sustain a loss of some or all of your initial investment and therefore you should not invest money that you cannot afford to lose. You should be aware of all the risks associated with foreign exchange trading, and seek advice from an independent financial advisor if you have any doubts.
Recommended content
Editors’ Picks
AUD/USD posts gain, yet dive below 0.6500 amid Aussie CPI, ahead of US GDP

The Aussie Dollar finished Wednesday’s session with decent gains of 0.15% against the US Dollar, yet it retreated from weekly highs of 0.6529, which it hit after a hotter-than-expected inflation report. As the Asian session begins, the AUD/USD trades around 0.6495.
USD/JPY finds its highest bids since 1990, approaches 156.00

USD/JPY broke into its highest chart territory since June of 1990 on Wednesday, peaking near 155.40 for the first time in 34 years as the Japanese Yen continues to tumble across the broad FX market.
Gold stays firm amid higher US yields as traders await US GDP data

Gold recovers from recent losses, buoyed by market interest despite a stronger US Dollar and higher US Treasury yields. De-escalation of Middle East tensions contributed to increased market stability, denting the appetite for Gold buying.
Ethereum suffers slight pullback, Hong Kong spot ETH ETFs to begin trading on April 30

Ethereum suffered a brief decline on Wednesday afternoon despite increased accumulation from whales. This follows Ethereum restaking protocol Renzo restaked ETH crashing from its 1:1 peg with ETH and increased activities surrounding spot Ethereum ETFs.
Dow Jones Industrial Average hesitates on Wednesday as markets wait for key US data

The DJIA stumbled on Wednesday, falling from recent highs near 38,550.00 as investors ease off of Tuesday’s risk appetite. The index recovered as US data continues to vex financial markets that remain overwhelmingly focused on rate cuts from the US Fed.