


Brent Oil and US Crude Oil Prices and Charts:
- US operating rigs increase.
- US-China trade wars could flare up again at the start of March.
Crude Oil Looks to US-China Trade Talks for Direction
With China back from its week-long holiday, oil traders will be looking for any US-China trade headlines to help decide the next move in the price of oil. On March 1, 2019 the current 10% tariff on Chinese imports already imposed will increase to 25% on trade worth approximately $200 billion. China has already said that it will retaliate if this increased tariff is imposed, leading to the US saying tat it will impose duties on another $267 billion of Chinese imports. These new tariffs, if imposed, will heightened fears that global growth will slow further, decreasing the demand for oil. The US and China are, and will continue to, discuss the trade impasse and it is possible that the March 1 could get pushed back if talks take a positive step forward.
The latest US Baker Hughes rig count showed an additional 7 rigs on stream in the week ending February 8, bringing the total to 854 operating rigs. US crude production continues to run a record pace around 11.9 million barrels a day, weighing on the price of US crude and Brent crude to a lesser extent.
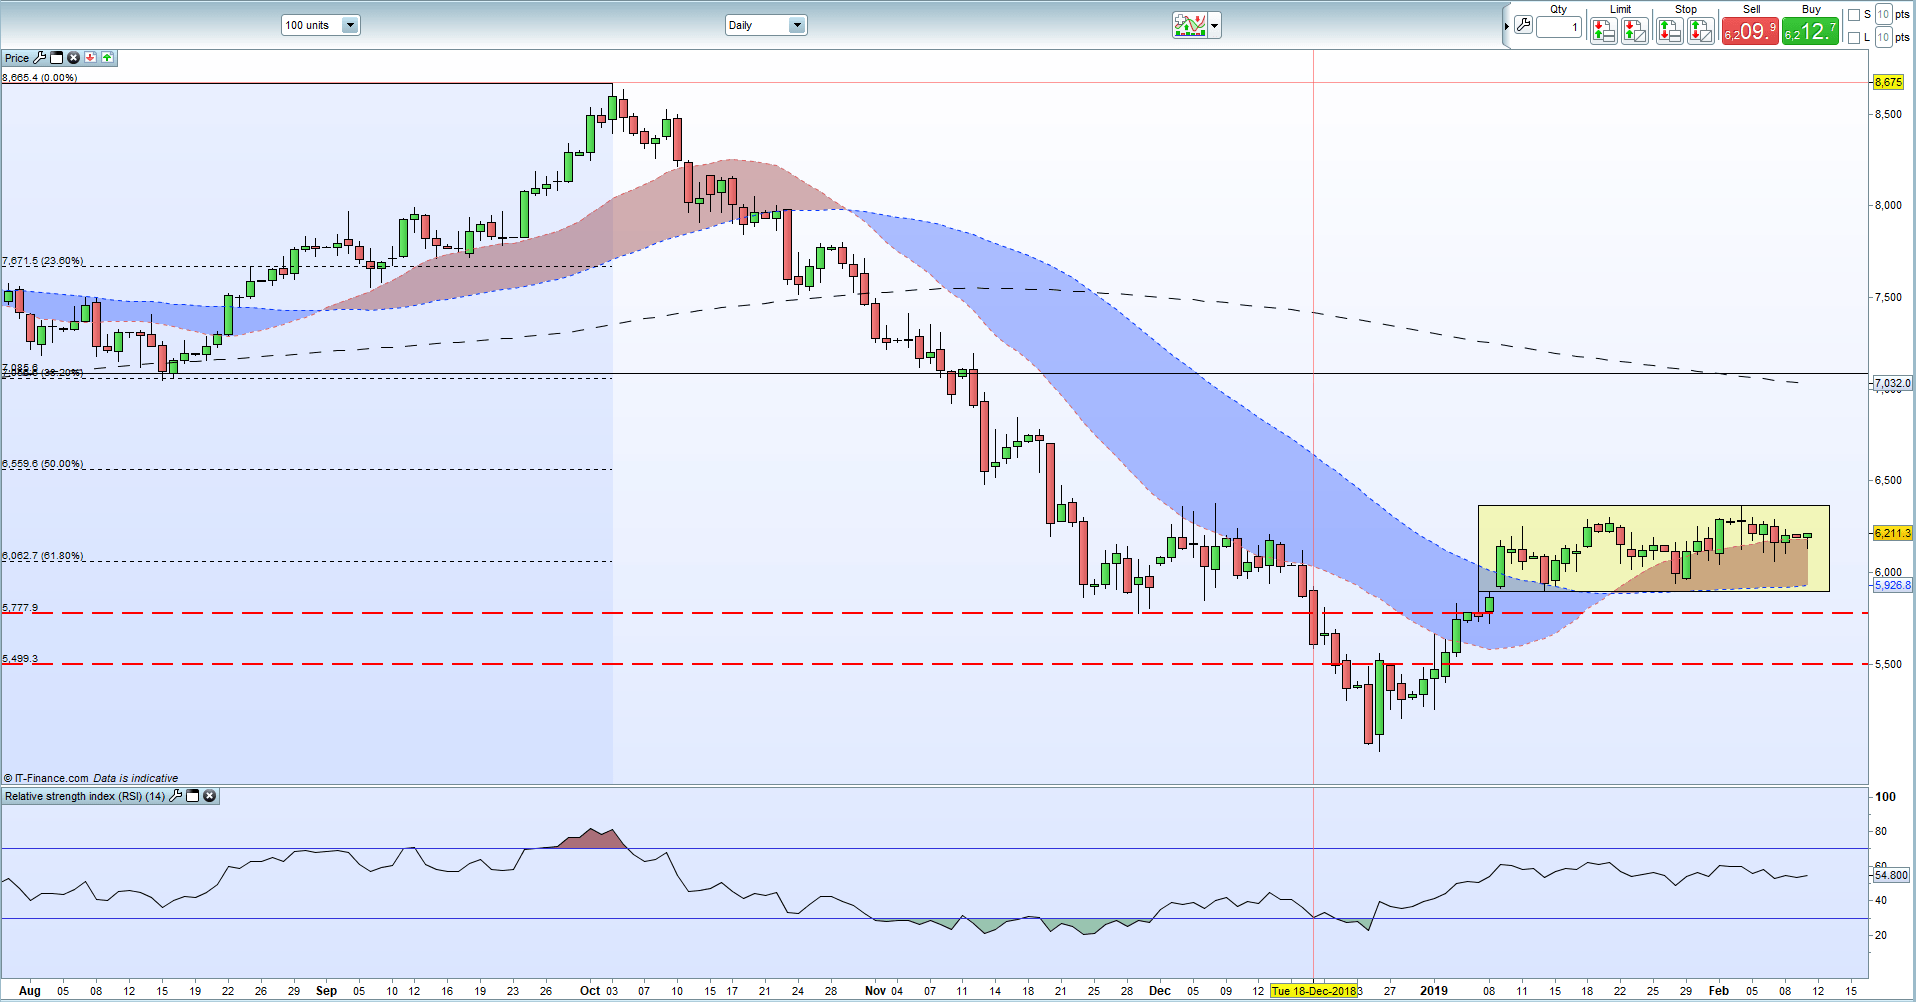
The chart shows the recent trading range holding between $58.90/bbl. and $63.85/bbl. and this is likely to need a nudge, probably to do with US-China trade, to help break its current sideways movement.
IG Retail Sentiment data show retail traders are 68.4% net-long US crude, a bearish contrarian indicator. However recent daily and weekly positional changes give us a mixed trading bias.
How to Trade Oil – Crude Oil Trading Strategies
Brent Crude Oil Daily Price Chart (August 2018 - February 11, 2019)
WTI vs Brent – Top 5 Differences Between WTI and Brent Crude Oil
Traders may be interested in two of our trading guides – Traits of Successful Traders and Top Trading Lessons – while technical analysts are likely to be interested in our latest Elliott Wave Guide.
What is your view on Oil – bullish or bearish?? You can let us know via the form at the end of this piece or you can contact the author at nicholas.cawley@ig.com or via Twitter @nickcawley1.


