


EUR/GBP Technical Analysis
- EUR/GBP continues slow ascent since bullish reversal pattern in January
- A critical area of resistance is being tested. If broken, uptrend may resume
- Meanwhile near-term support has been reinforced. A fall may be short-lived
Just started trading EUR/GBP? Check out our beginners’ FX markets guide !
EUR/GBP continues to make cautious progress to the upside in the aftermath of a bullish candlestick pattern. This followed a push above a descending resistance line from earlier in January which was since resulted in gains of about 2.11% at the time of this writing. Concerning Brexit headlines seemed to set the fundamental backdrop as the chances of a "no-deal" outcome increased, sinking the British Pound.
In the meantime, EUR/GBP finds itself in a horizontal resistance range between 0.88384 and 0.88108. This area consists of the lows achieved back in November 2018. This was then retested in the middle of January. A close above this area may open the door to climbing to 0.89225 next, which is the lower boundary of the next area of resistance.
EUR/GBP Daily Chart

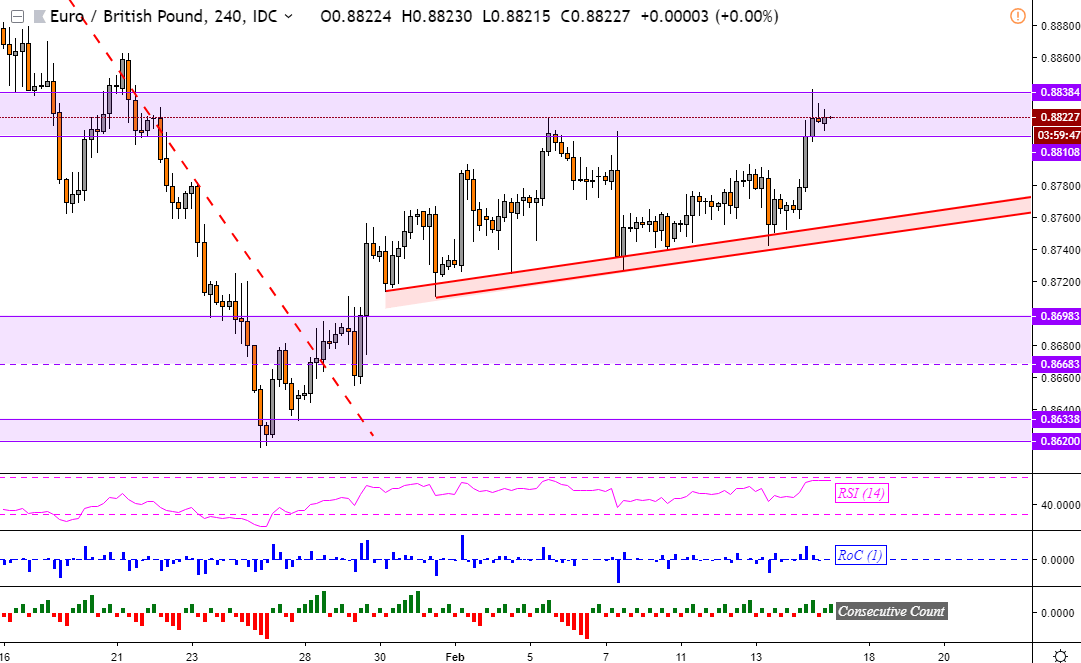
EUR/GBP 4-Hour Chart
Looking at the 4-hour chart below, there are more reasons to believe that - in the medium term - EUR/GBP may find itself pushing higher. A rising range of support has been carved out since the end of January. Should prices fall in the short term, these rising trend lines may catch a descent which could turn back into a climb. If the pair falls through this area, the next support barrier appears to be around 0.86983. You may follow me at @ddubrovskyFX for more timely updates in EUR/GBP.
**Charts created in TradingView
FX Trading Resources
- Join a free Q&A webinar and have your trading questions answered
- Just getting started? See our beginners’ guide for FX traders
- See our free guide to learn what are the long-term forces Euro prices
- See how the British Pound and Euroare viewed by the trading community at the DailyFX Sentiment Page
--- Written by Daniel Dubrovsky, Junior Currency Analyst for DailyFX.com
To contact Daniel, use the comments section below or @ddubrovskyFX on Twitter


