


EURUSD Holds Lows at Key Support as USD Strength Takes a Pause
- US Dollar strength has continued into another week, as a strong day of price action on Monday led to a push up to fresh 2019 highs. Pullbacks showed in the Dollar on both Tuesday and Thursday but, up to this point, buyers have remained very motivated, offering higher-low support at prior resistance intervals on the chart around 96.68 and 97.00.
- Next week brings a Monday holiday in the United States in observance of President’s Day, and the economic calendar is relatively light. The high-notes for next week’s calendar are FOMC meeting minutes from the January rate decision, set to be released on Wednesday, followed by Central Bank comments out of Canada and Australia on Thursday. On the FOMC-front, Fed-speak is on the docket for everyday next week from Tuesday-Friday.
- DailyFX Forecasts are published on a variety of currencies such as the US Dollar or the Euro and are available from the DailyFX Trading Guides page. If you’re looking to improve your trading approach, check out Traits of Successful Traders. And if you’re looking for an introductory primer to the Forex market, check out our New to FX Guide.
Do you want to see how retail traders are currently trading the US Dollar? Check out our IG Client Sentiment Indicator.
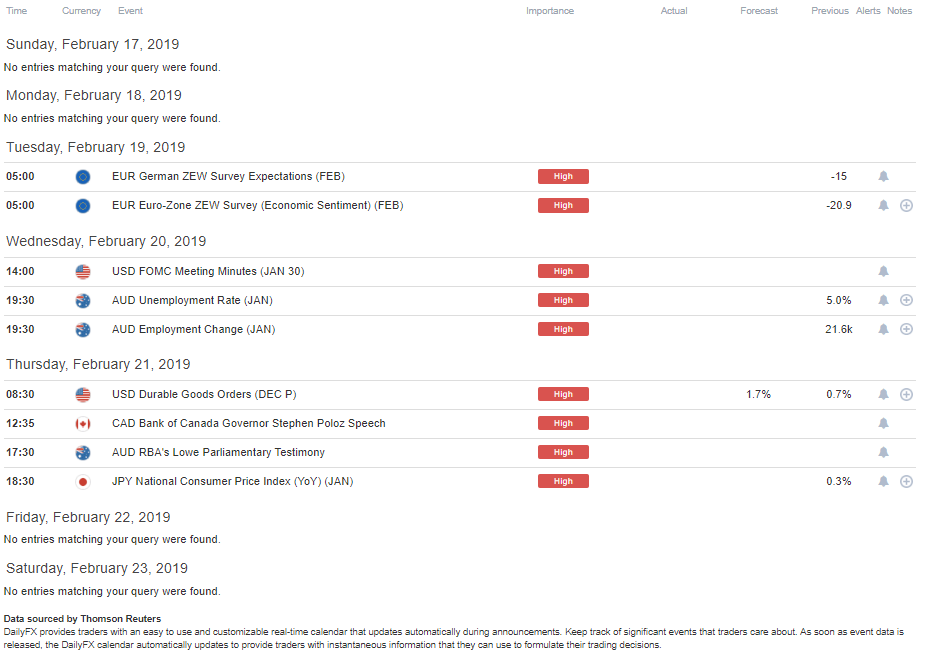
Next week brings a Monday holiday in the US as both stock and bond markets will be closed in observance of President’s Day. But after that, the economic calendar brings Fed-speak for every day next week, combined with the Wednesday release of FOMC meeting minutes from the January rate decision. Outside of that, next week’s economic calendar is rather shallow with just a handful of high-impact prints; the highlight of which is in the latter portion of the week when Central Bank heads from Canada and Australia offer commentary, going along with Japanese CPI numbers for the month of January.
DailyFX Economic Calendar: High-Impact Events for the Week of February 18, 2019
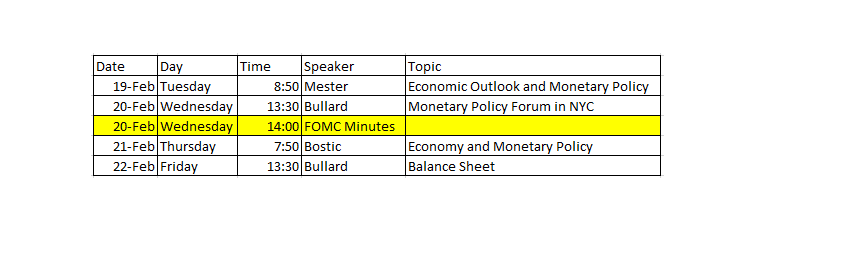
And on the Fed-speak front, the below table shows the Fed speakers on next week’s economic calendar, along with time of commentary and the targeted topic.
FOMC Speakers on the Economic Calendar for Next Week
US Dollar Bulls Face Turbulence at 97.20; Hold Support at 97.00
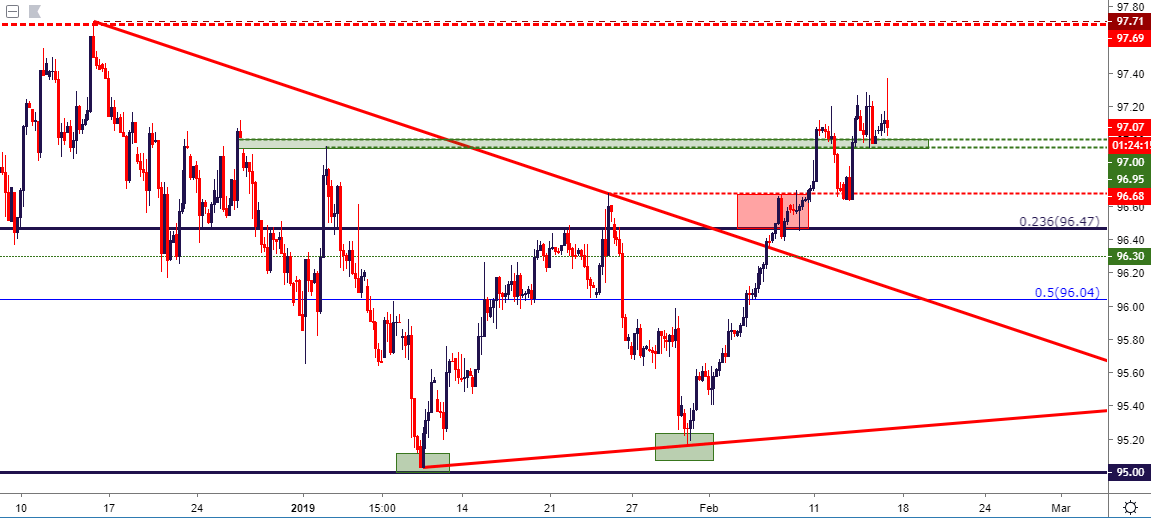
All-in-all it’s been another strong week of price action in the US Dollar, with the bulk of the upward advance showing in the first half of this week. On Monday, the currency broke-out to a fresh 2019 high after which a quick pullback to find support at the 96.68 level showed up. But the response at that support was rather strong, as Dollar bulls posed another top-side drive on Wednesday to push up to another fresh high.
But since then, prices have oscillated with support continuing to hold around that prior swing high and the support area around 97.00.
US Dollar Four-Hour Price Chart
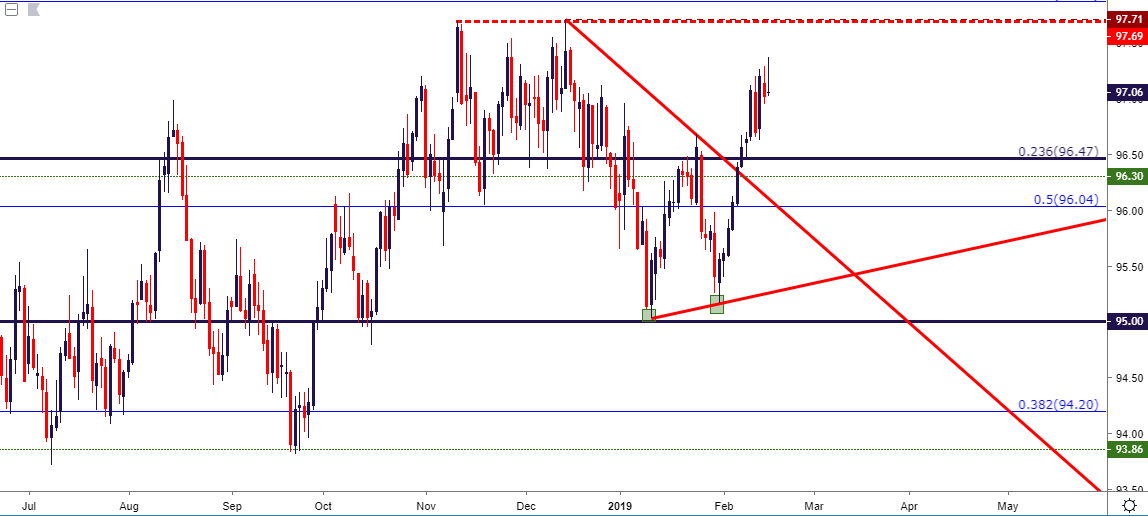
For next week, the big question is for how much longer might USD bulls be able to continue pushing higher before a deeper pullback shows up. Ahead on the charts is the 97.71 level that helped to build a Double Top formation in the currency in November and December. A break-above that level would bring the highest print in the US Dollar since June of 2017, as the currency found a bit of resistance there before continuing its downward-descent.
US Dollar Daily Price Chart
EURUSD Holding Lows in Key Support Zone
Contributing to that US Dollar strength has been continued weakness in the Euro as political risks continue to show in the bloc. Spain has now become of concern, and European elections coming this May have many on their seat as anti-establishment parties may make a dent in the status quo of European Parliament. This goes along with continued slowdown in European economic data, illustrated again on Wednesday with the -4.2% print for Euro-Zone industrial production.
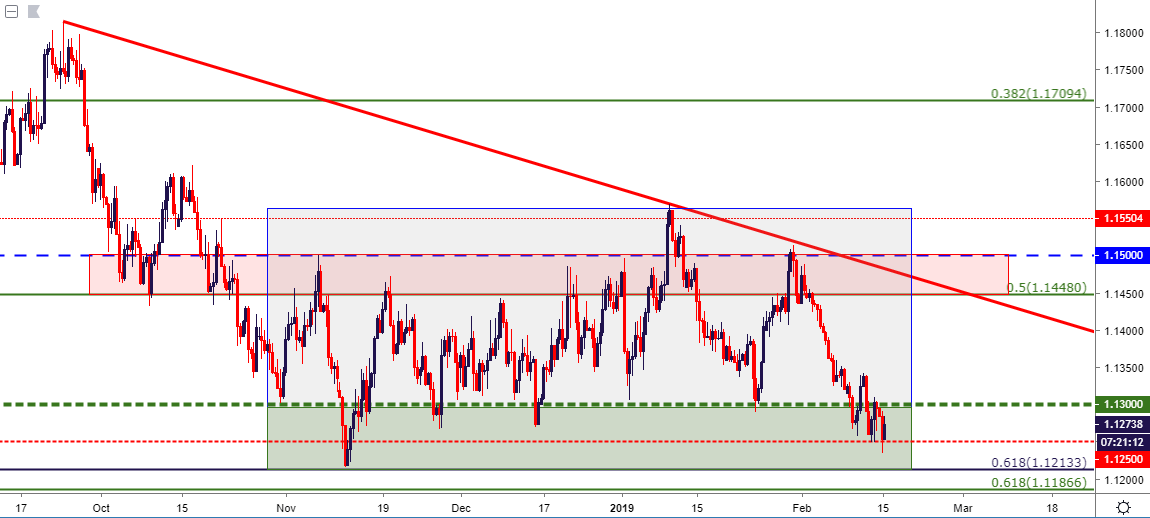
In EURUSD price action, the pair is posing another bounce in the longer-term support zone that came into play earlier this week. This support zone has held the lows in the pair since November, when fear was running high around the Italian budget. But since that swing-low was set on November 8th at 1.1215, prices have been unable to break-lower, seeing multiple support inflections when this zone of prices had come into play.
EURUSD Eight-Hour Price Chart
Dow Tests Above Confluent Resistance – Can Buyers Hold the Move?
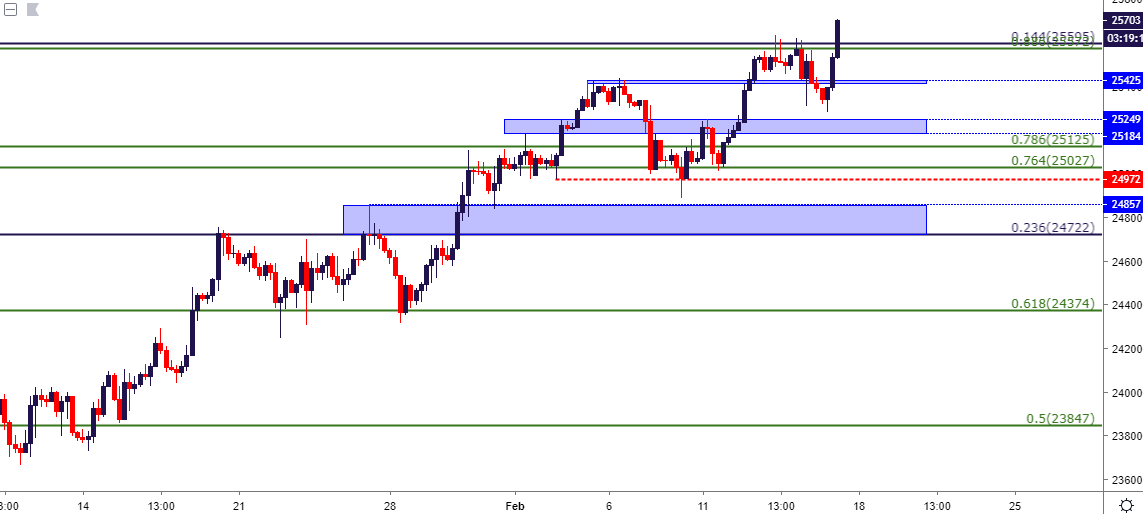
Also of note, US equity indices ran into some key resistance levels this week. After a firm push higher on Monday, a confluent resistance zone came into play on the Dow Jones Industrial Average and, since then, prices have spent the past few days in a range-like state. This resistance in the Dow comes from a couple of different areas, as the 88.6% retracement of the December sell-off remains very near the 14.4% retracement of the post-Election run in the index. In early-Friday trade, buyers have made a stern topside advance above this zone, bringing up the question of whether or not they can hold the line.
Dow Jones Price Chart
USDJPY Recovery Continues, Support Holds Above 110.00
On the long side of the US Dollar, the backdrop around USDJPY remains of interest. The pair came into the year screaming lower on the back of significant Yen-strength that appeared to be largely driven by a safe-haven run. But since the second day of the New Year, prices in the pair have largely remained in varying states of recovery.
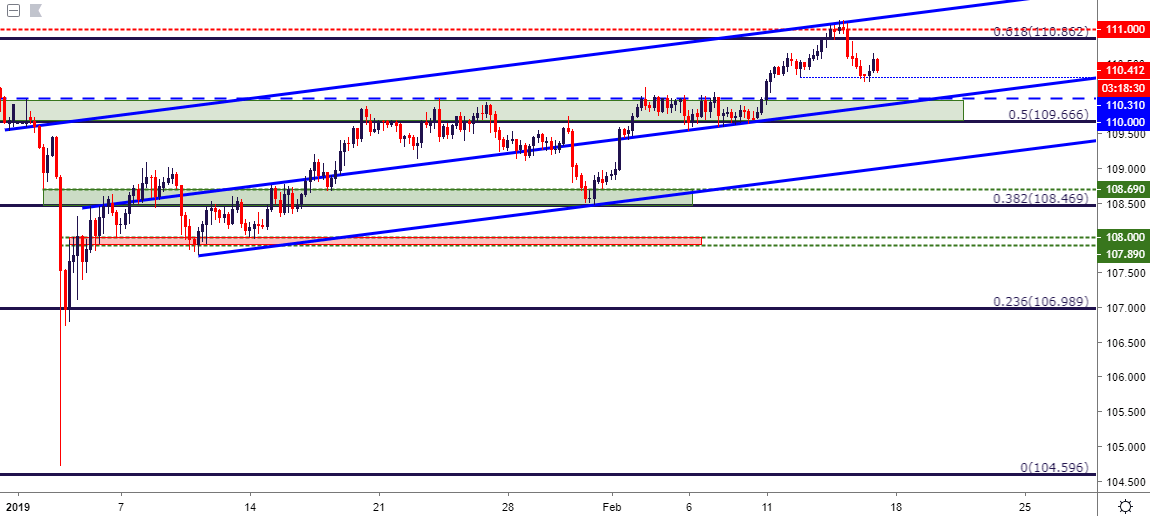
Last week, price action in the pair had begun to build in a short-term range atop intermediate-term resistance, focusing in on the zone from 109.67-110.00. And coming into this week, bulls pushed through, helping to set a fresh 2019 high in the pair as prices ran up-above the 111.00 level. But, as discussed yesterday, that theme appeared rip for a pullback, and prices pushed down to the 110.30 level of support that was noted; after which bulls began to make another forward push.
The big question at this point is whether the yesterday’s retracement was enough; or whether prices will need to take a deeper pause to re-test support at that prior area of resistance that held for almost a full month at 109.67-110.00.
USDJPY Four-Hour Price Chart
USD Reversal Strategies
Given the length of the current US Dollar rally, the prospect of a pullback can remain of interest, even if just a temporary pullback in a longer-term scenario of strength. But, given the manner with which that Dollar-strength has shown of recent, it can be difficult to prognosticate reversal scenarios in an area like the Euro or the British Pound, each which could continue to be beset by political woes.
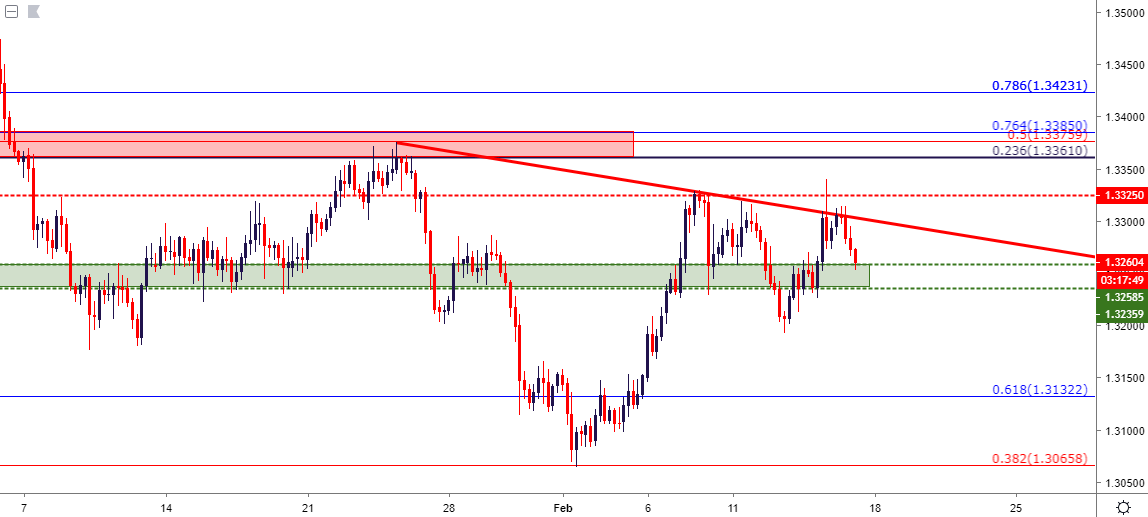
As discussed in yesterday’s webinar, there could be interest around USD-weakness in pairs like USD/CAD or USD/CHF. In USD/CAD, prices have held below the 1.3361-1.3385 resistance zone; and a bearish trend-line as taken from earlier January and February swing-highs continues to show some element of resistance on intra-day charts.
USDCAD Four-Hour Price Chart
USDCHF Spends a Week at Resistance
The week opened with a bang in the Swiss Franc as the currency posed a quick move of weakness that could be described as a ‘mini flash crash.’ But, USDCHF buyers were unable to test above the 1.0100 level and after pulling back to parity, buyers drove right back-up to resistance around the 1.0096 level, which is the 78.6% retracement of the December 2016 – February 2018 major move.
If sellers can hold this resistance through the early portion of next week, this could become a scenario of interest for a deeper pullback in the recent theme of US Dollar strength.
USDCHF Daily Price Chart
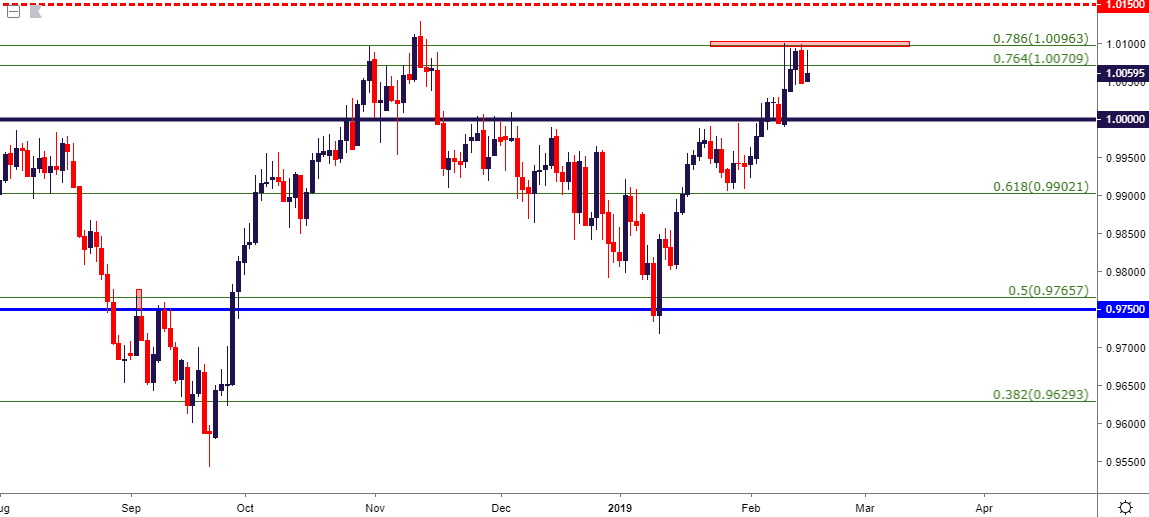
Chart prepared by James Stanley
To read more:
Are you looking for longer-term analysis on the U.S. Dollar? Our DailyFX Forecasts have a section for each major currency, and we also offer a plethora of resources on USD-pairs such as EUR/USD, GBP/USD, USD/JPY, AUD/USD. Traders can also stay up with near-term positioning via our IG Client Sentiment Indicator.
Forex Trading Resources
DailyFX offers an abundance of tools, indicators and resources to help traders. For those looking for trading ideas, our IG Client Sentiment shows the positioning of retail traders with actual live trades and positions. Our trading guides bring our DailyFX Quarterly Forecasts and our Top Trading Opportunities; and our real-time news feed has intra-day interactions from the DailyFX team. And if you’re looking for real-time analysis, our DailyFX Webinars offer numerous sessions each week in which you can see how and why we’re looking at what we’re looking at.
If you’re looking for educational information, our New to FX guide is there to help new(er) traders while our Traits of Successful Traders research is built to help sharpen the skill set by focusing on risk and trade management.
--- Written by James Stanley, Strategist for DailyFX.com
Contact and follow James on Twitter: @JStanleyFX


