- The AUD/CAD pair trades around 0.9460 at the start Asian trading on Monday.
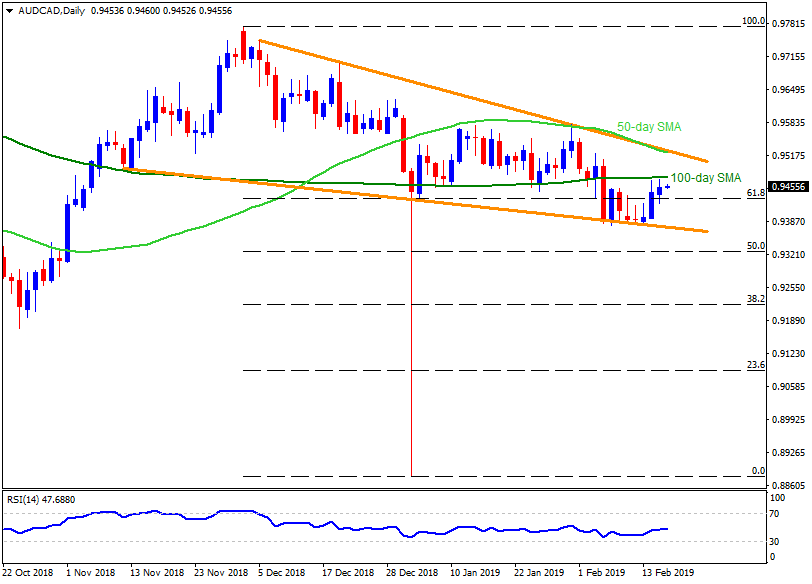
- The pair has been struggling to clear the 100-day simple moving average (SMA), currently at 0.9475, since Thursday.
- Should the pair manage to conquer the 0.9475 upside barrier, it can surpass 0.9500 round-figure to head towards 0.9515 resistance.
- However, 50-day SMA and a descending trend-line connecting highs since December 05 can confine the pair’s further advances at 0.9525.
- If at all prices rally beyond 0.9525, they confirm a short-term “falling wedge” bullish formation and can escalate the upmoves to 0.9525 and 0.9630 numbers to north.
- Meanwhile, 61.8% Fibonacci retracement of its December to January downturn, at 0.9430, could become nearby support for the pair.
- Given the quote slips under 0.9430, 0.9400 and a downward sloping trend-line, at 0.9370, seem crucial levels to watch for sellers.
- Also, pair’s daily closing under 0.9370 might not hesitate flashing the 50% Fibo level 0.9325 and 0.9300 supports back on the chart.
AUD/CAD daily chart
Additional important levels:
Overview:
Today Last Price: 0.9462
Today Daily change: 1 pips
Today Daily change %: 0.01%
Today Daily Open: 0.9461
Trends:
Daily SMA20: 0.947
Daily SMA50: 0.9537
Daily SMA100: 0.9485
Daily SMA200: 0.9561
Levels:
Previous Daily High: 0.9473
Previous Daily Low: 0.9423
Previous Weekly High: 0.9473
Previous Weekly Low: 0.9382
Previous Monthly High: 0.9646
Previous Monthly Low: 0.9161
Daily Fibonacci 38.2%: 0.9454
Daily Fibonacci 61.8%: 0.9442
Daily Pivot Point S1: 0.9432
Daily Pivot Point S2: 0.9402
Daily Pivot Point S3: 0.9382
Daily Pivot Point R1: 0.9482
Daily Pivot Point R2: 0.9502
Daily Pivot Point R3: 0.9532
Information on these pages contains forward-looking statements that involve risks and uncertainties. Markets and instruments profiled on this page are for informational purposes only and should not in any way come across as a recommendation to buy or sell in these assets. You should do your own thorough research before making any investment decisions. FXStreet does not in any way guarantee that this information is free from mistakes, errors, or material misstatements. It also does not guarantee that this information is of a timely nature. Investing in Open Markets involves a great deal of risk, including the loss of all or a portion of your investment, as well as emotional distress. All risks, losses and costs associated with investing, including total loss of principal, are your responsibility. The views and opinions expressed in this article are those of the authors and do not necessarily reflect the official policy or position of FXStreet nor its advertisers. The author will not be held responsible for information that is found at the end of links posted on this page.
If not otherwise explicitly mentioned in the body of the article, at the time of writing, the author has no position in any stock mentioned in this article and no business relationship with any company mentioned. The author has not received compensation for writing this article, other than from FXStreet.
FXStreet and the author do not provide personalized recommendations. The author makes no representations as to the accuracy, completeness, or suitability of this information. FXStreet and the author will not be liable for any errors, omissions or any losses, injuries or damages arising from this information and its display or use. Errors and omissions excepted.
The author and FXStreet are not registered investment advisors and nothing in this article is intended to be investment advice.
Recommended content
Editors’ Picks
EUR/USD fluctuates near 1.0700 after US data

EUR/USD stays in a consolidation phase at around 1.0700 in the American session on Wednesday. The data from the US showed a strong increase in Durable Goods Orders, supporting the USD and making it difficult for the pair to gain traction.
USD/JPY refreshes 34-year high, attacks 155.00 as intervention risks loom

USD/JPY is renewing a multi-decade high, closing in on 155.00. Traders turn cautious on heightened risks of Japan's FX intervention. Broad US Dollar rebound aids the upside in the major. US Durable Goods data are next on tap.
Gold stays in consolidation above $2,300

Gold finds it difficult to stage a rebound midweek following Monday's sharp decline but manages to hold above $2,300. The benchmark 10-year US Treasury bond yield stays in the green above 4.6% after US data, not allowing the pair to turn north.
Worldcoin looks set for comeback despite Nvidia’s 22% crash Premium

Worldcoin price is in a better position than last week's and shows signs of a potential comeback. This development occurs amid the sharp decline in the valuation of the popular GPU manufacturer Nvidia.
Three fundamentals for the week: US GDP, BoJ and the Fed's favorite inflation gauge stand out Premium

While it is hard to predict when geopolitical news erupts, the level of tension is lower – allowing for key data to have its say. This week's US figures are set to shape the Federal Reserve's decision next week – and the Bank of Japan may struggle to halt the Yen's deterioration.