
USDPLN Buyers In Control As October High Breaks
In this blog, we will take a look at the mid-term and short-term Elliott wave structure of this Forex pair and what we can expect going forward. We have also overlaid DXY (US Dollar Index) chart with USDPLN for the readers that we would be presenting towards the end of the article.
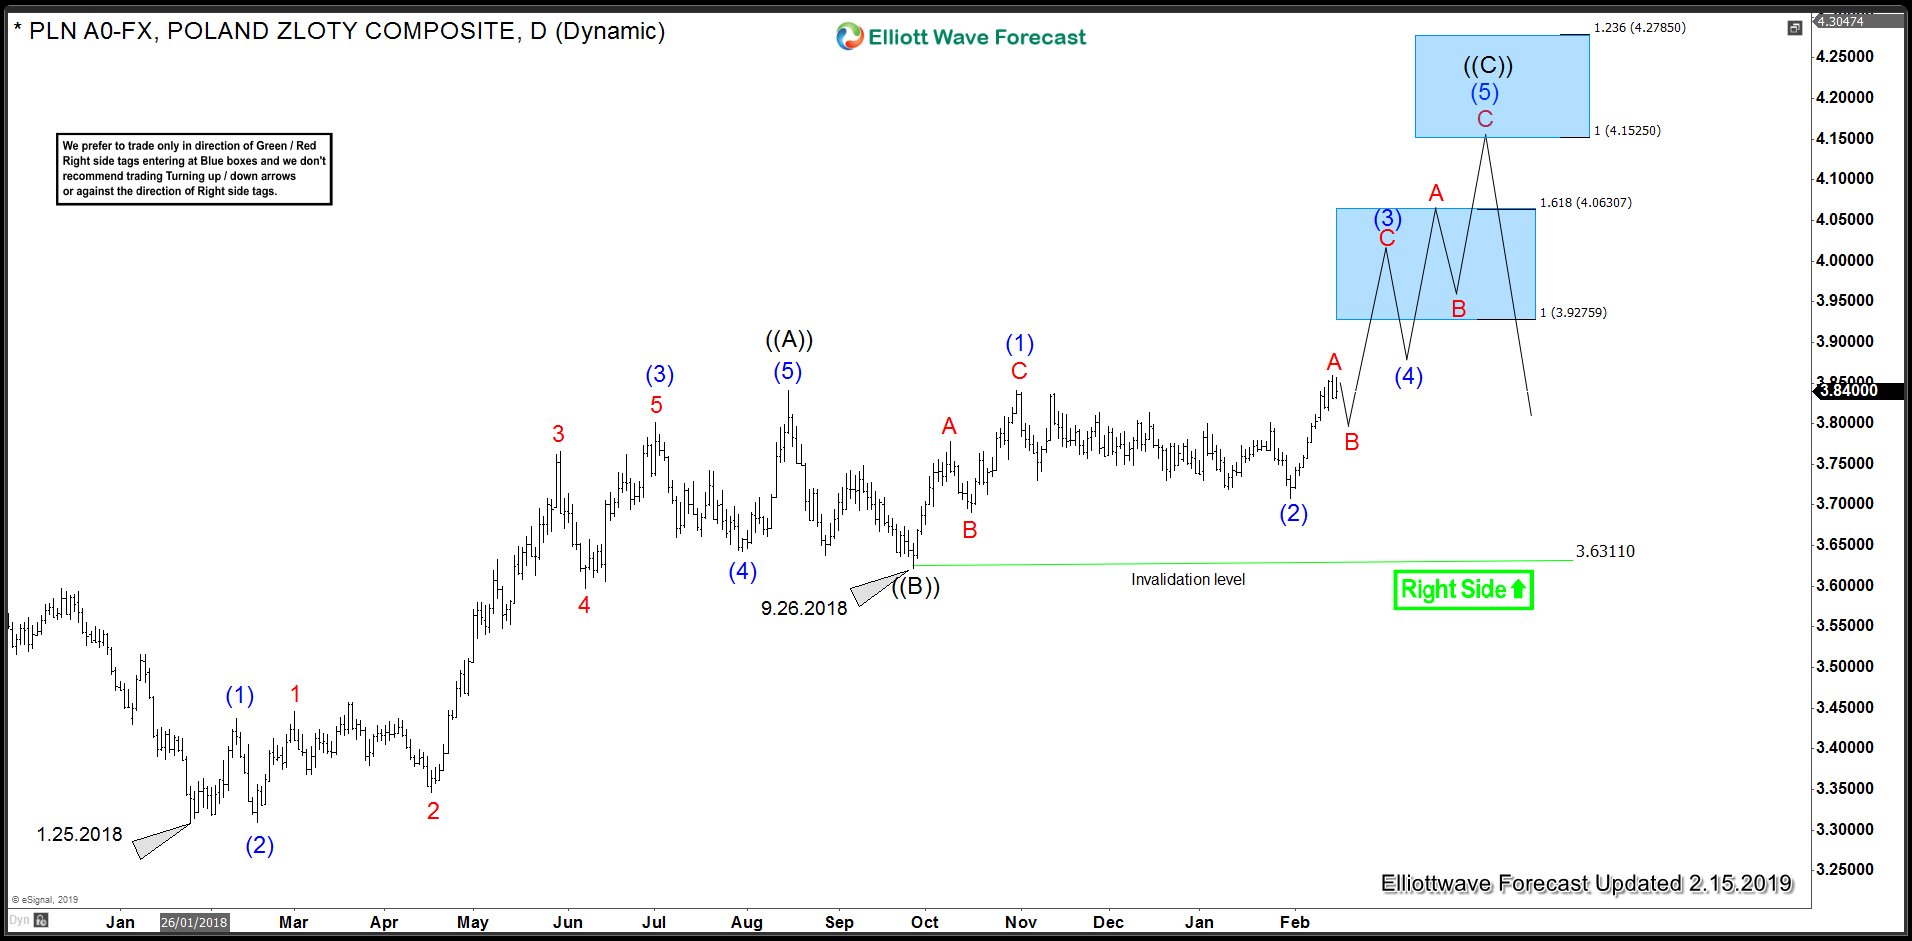
USDPLN Elliott Wave Analysis - Daily Chart
Chart below shows rally from 1.25.2018 low to August 2018 peak labelled as wave ((A)) was in an Elliott Wave Impulse with an extended wave (3). This was followed by a 3 waves pull back 3.631 which completed wave ((B)). Following this wave ((B)) pull back, pair rallied to a new high in October 2018 but the rally was in 3 waves which left the door open for further sideways consolidation in the form of a triangle or an Elliott Wave FLAT in wave ((B)) with the other possibility that being of an Elliott Wave Diagonal ((C)) wave which sub-divides in 3-3-3-3-3. Following a 3 waves pull back to 3.7063, pair has broken above October 2018 peak which supports the idea of ((C)) wave diagonal.
Now there are two ways in which this ((C)) wave diagonal could unfold. Near-term (as we will show in the 1 hour chart below) dips are expected to hold above 3.7063 low for extension higher toward 3.9257 - 4.0630 area which is 100 - 161.8 Fibonacci extension of the initial 3 waves rally from September 2018 low to October 2018 peak. Depending on how high we go within the blue box, we should end wave (3) of ((C)) or just wave (1) of ((C)) but in either case, we should be expecting more upside as far as prices stay above 3.7063 and more importantly above 3.631.
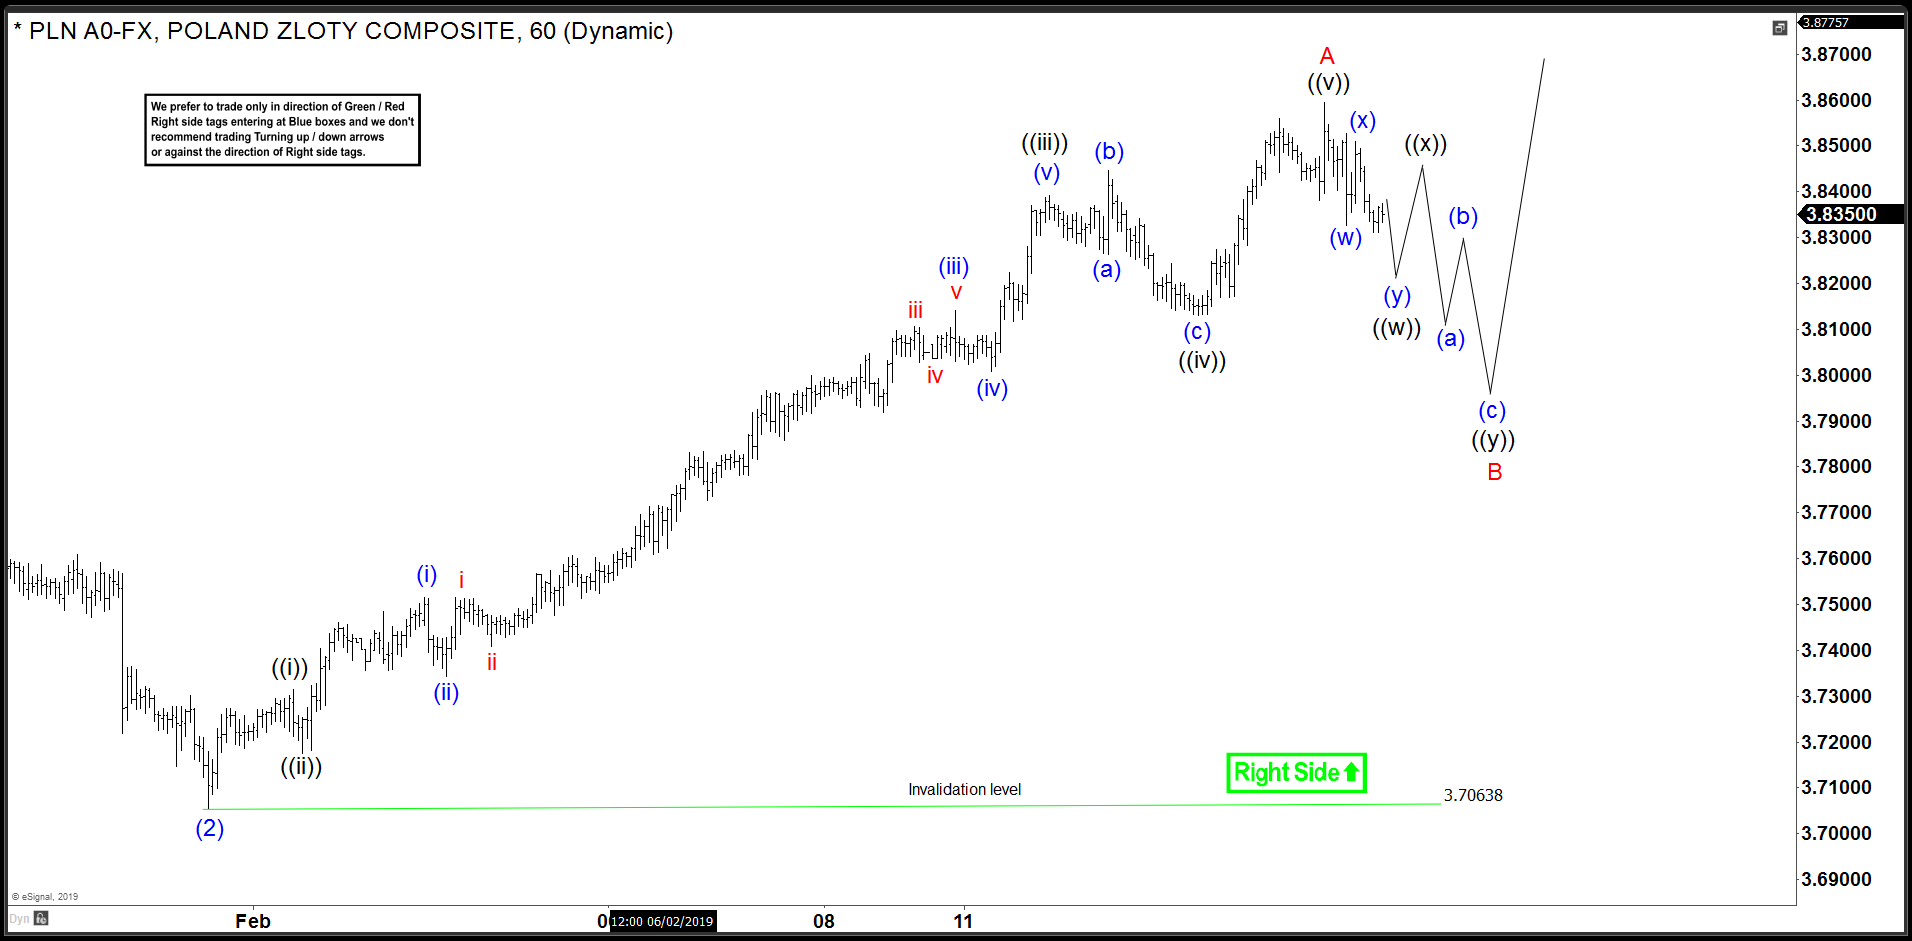
USDPLN Impulsive Elliott Wave Rally from 1/31 low
Chart below is a 1 Hour chart of USDPLN Forex pair and we can see a clear Elliott Wave Impulse with an extended wave ((iii)) and wave (iii) of ((iii)) was also extended. Pivot at black wave ((iv)) low has given up which supports the view that Impulsive rally in the form of wave A has completed at 3.8594 and a pull back in wave B should now be in progress. As pair has got 5 swings up from 3.631 low (see daily chart above), wave B pull back is expected to see buyers and then pair should turn higher as far as dips hold above 3.7063 low.
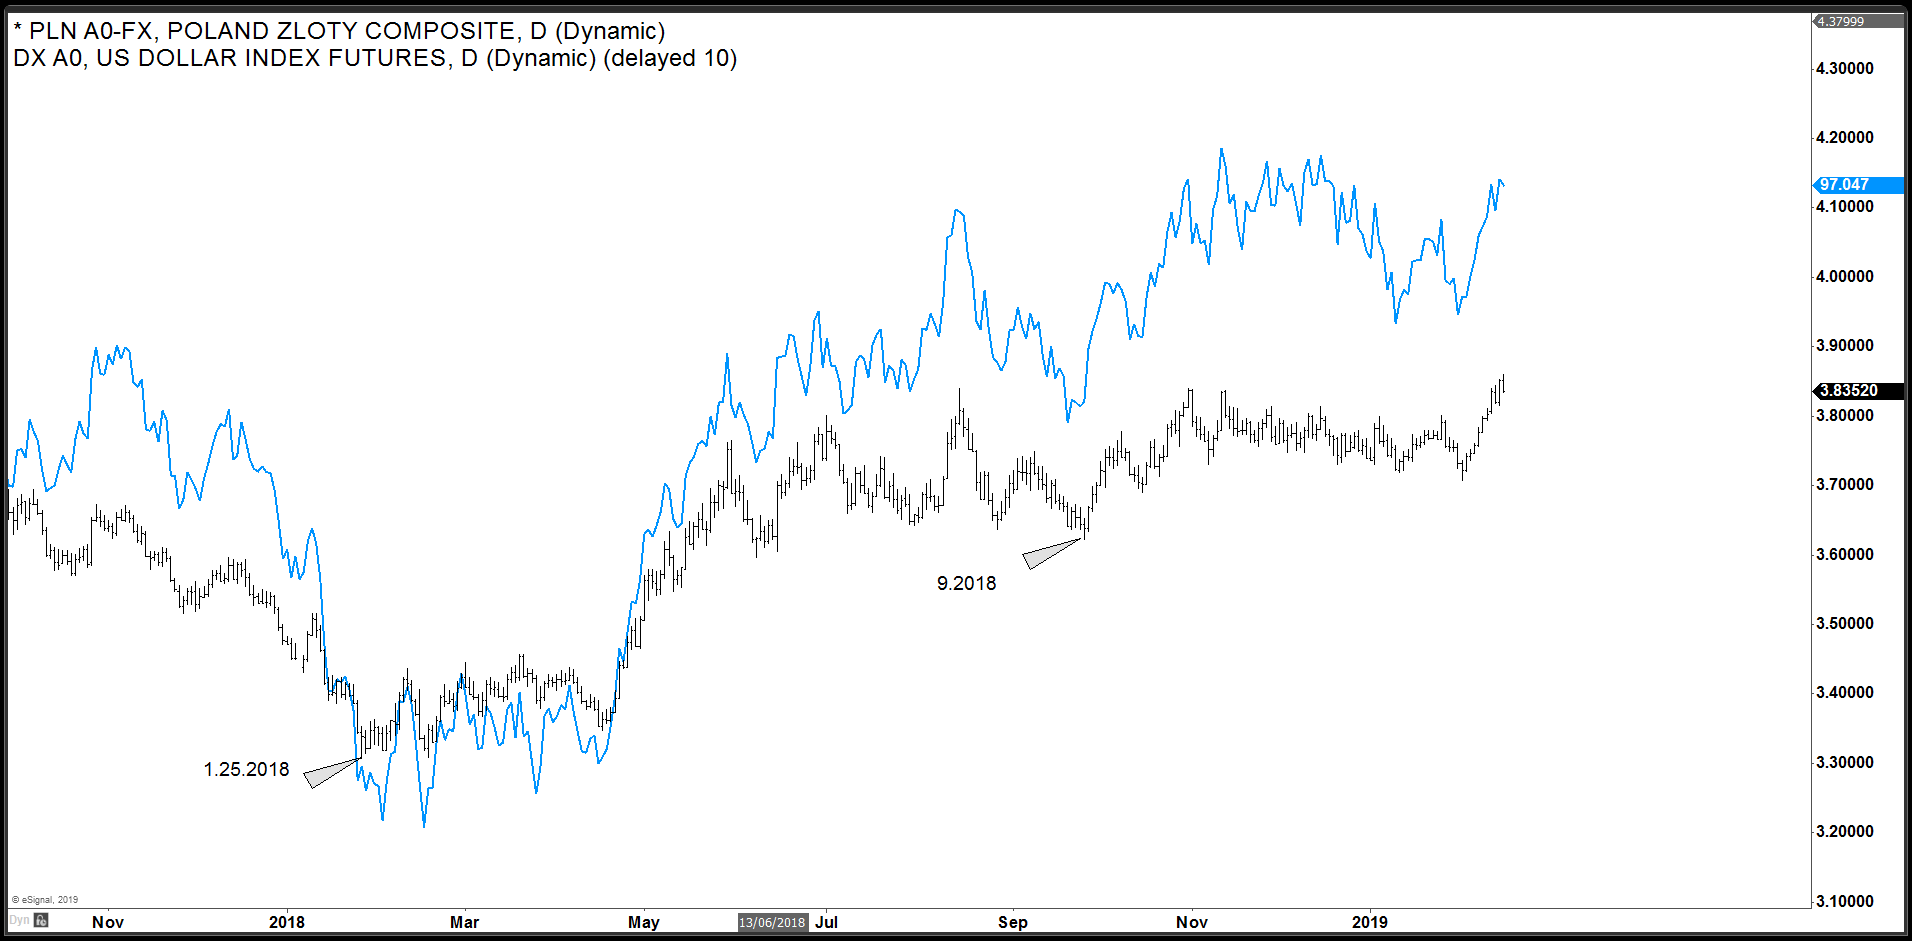
USDPLN and DXY Overlay
Chart below is an overlay of US Dollar Index with USDPLN and we can see both made a low in January 2018 and then a secondary low in September 2018. USDPLN has already broken above August and October peaks and appears to be leading the rally in US Dollar Index.
Disclaimer: Futures, options, and over the counter foreign exchange products may involve substantial risk and may not be suitable for all investors. Leverage can work against you as well as for ...
more

