
EOS Token Price Looking For A Technical Recovery
2018 was the worst year for cryptocurrency investors as the market saw a significant price drop but despite that, EOS coin managed to make new all time highs during the year and reached a price of $23.
We'll take a look at the technical chart of the token using Elliott wave theory to understand the structure:
EOS Daily Chart 02.09.2019
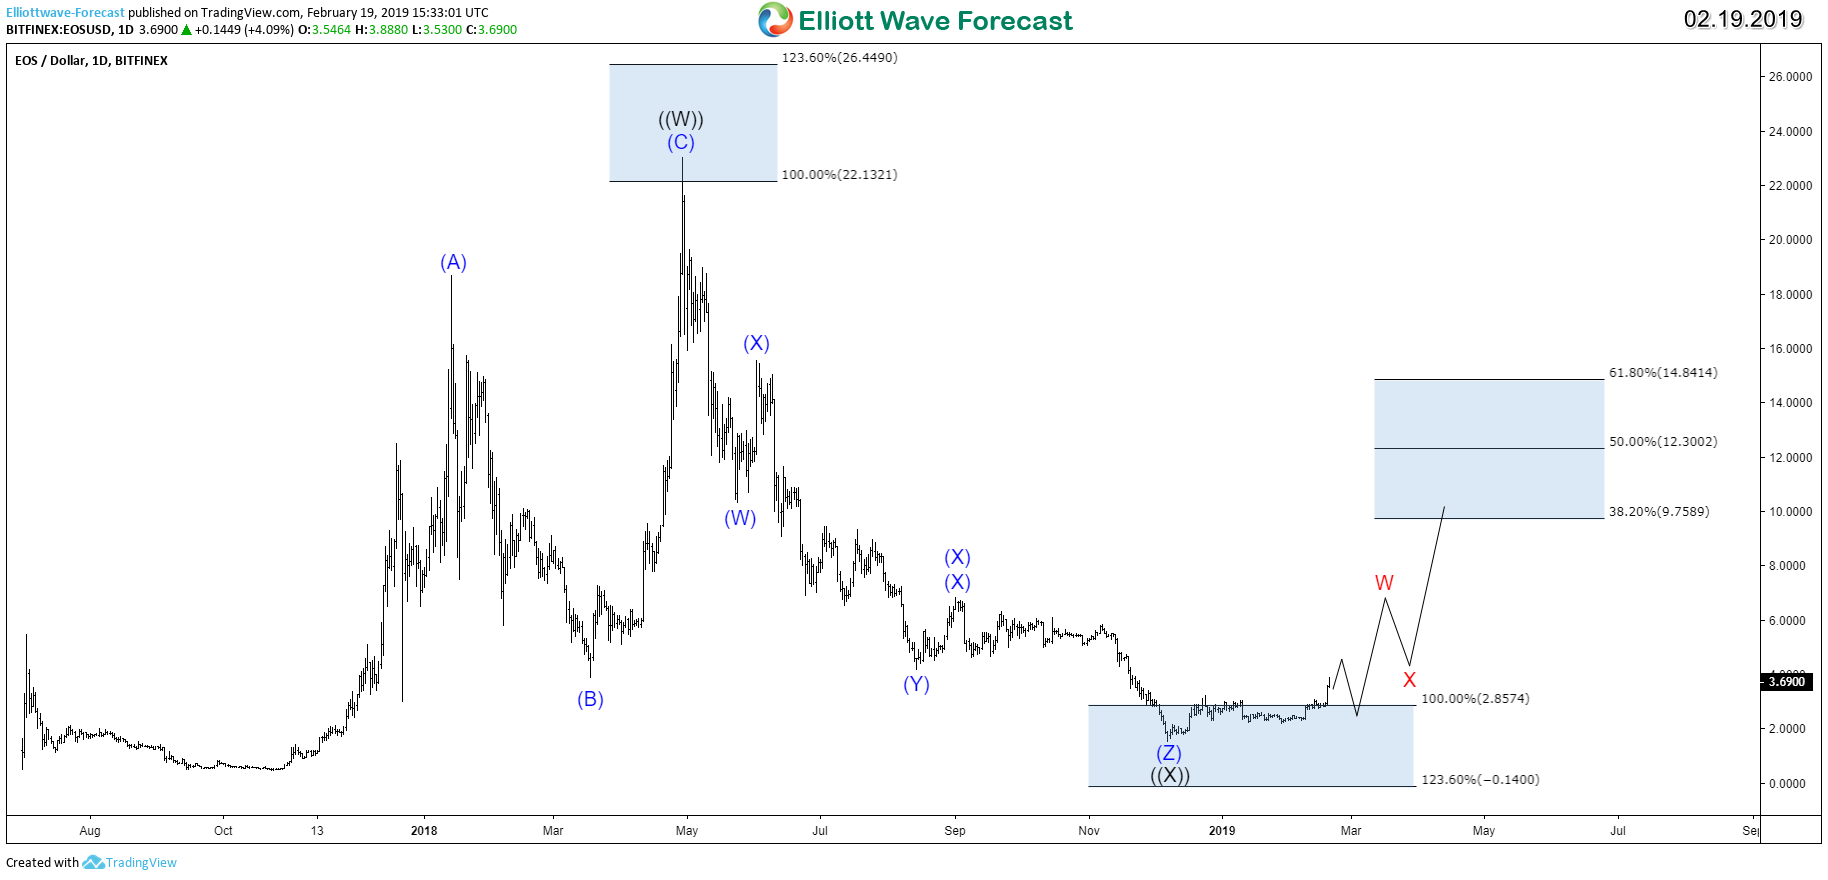
EOS first rally from July 2017 was in 3 waves higher which found sellers around blue box area $22 - $26. Down from there, the price declined in a corrective triple three structure before finally finding a low around the 100% Fibonacci extension area $2.8.
The nature of the bounce at this stage isn't yet defining the new cycle as it's only showing 3 swings from the low but it managed to end the decline from April 2018 peak. Therefore, EOS at this stage is either starting a new cycle to the upside or looking to correct the previous decline at least toward $9 - $14 area.
The cryptocurrency market witnessed its longest bear market and there is no clear signal that it ended. However with the recovery in EOS and with further data later on, the situation could switch if the major coins like Bitcoin and Ethereum show a similar bounce.
Disclaimer: Futures, options, and over the counter foreign exchange products may involve substantial risk and may not be suitable for all investors. Leverage can work against you as well as for ...
more

