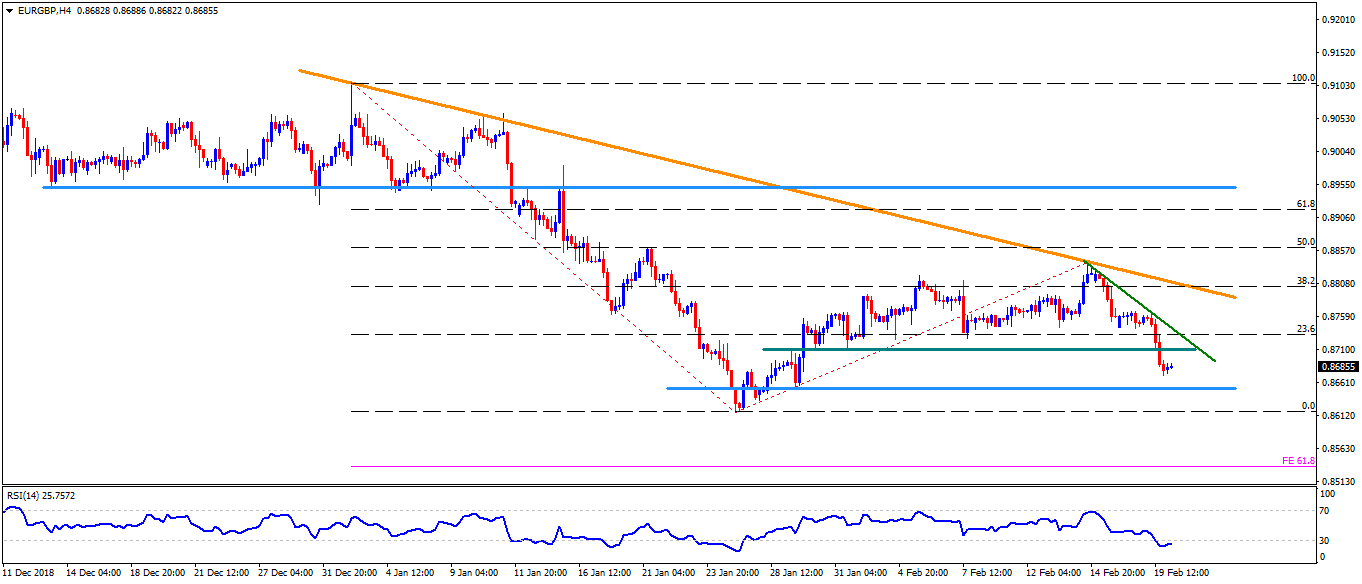
- EUR/GBP trades near 0.8690 heading towards European open on Wednesday.
- The pair slid beneath 0.8710 horizontal-support connecting late-January lows, which in turn opens the door for an extended decline to 0.8655 support.
- However, oversold levels of 14-bar relative strength index (RSI) may limit the pair’s downside around 0.8655, if not then 0.8615 and 61.8% Fibonacci expansion of its moves from January to mid-February, at 0.8535, can mark their presence on the chart.
- On the flipside, 0.8690 and immediate descending trend-line, at 0.8750, can restrict the pair’s near-term advances.
- In case prices rally beyond 0.8750, 0.8765 and 0.8790 may please the buyers ahead of luring them towards seven-week-old downward sloping resistance-line, at 0.8810.
Additional important levels:
Overview:
Today Last Price: 0.8686
Today Daily change: 5 pips
Today Daily change %: 0.06%
Today Daily Open: 0.8681
Trends:
Daily SMA20: 0.8745
Daily SMA50: 0.8872
Daily SMA100: 0.8854
Daily SMA200: 0.8864
Levels:
Previous Daily High: 0.8764
Previous Daily Low: 0.8671
Previous Weekly High: 0.8842
Previous Weekly Low: 0.8743
Previous Monthly High: 0.9119
Previous Monthly Low: 0.8617
Daily Fibonacci 38.2%: 0.8707
Daily Fibonacci 61.8%: 0.8729
Daily Pivot Point S1: 0.8647
Daily Pivot Point S2: 0.8612
Daily Pivot Point S3: 0.8553
Daily Pivot Point R1: 0.874
Daily Pivot Point R2: 0.8799
Daily Pivot Point R3: 0.8834
Information on these pages contains forward-looking statements that involve risks and uncertainties. Markets and instruments profiled on this page are for informational purposes only and should not in any way come across as a recommendation to buy or sell in these assets. You should do your own thorough research before making any investment decisions. FXStreet does not in any way guarantee that this information is free from mistakes, errors, or material misstatements. It also does not guarantee that this information is of a timely nature. Investing in Open Markets involves a great deal of risk, including the loss of all or a portion of your investment, as well as emotional distress. All risks, losses and costs associated with investing, including total loss of principal, are your responsibility. The views and opinions expressed in this article are those of the authors and do not necessarily reflect the official policy or position of FXStreet nor its advertisers. The author will not be held responsible for information that is found at the end of links posted on this page.
If not otherwise explicitly mentioned in the body of the article, at the time of writing, the author has no position in any stock mentioned in this article and no business relationship with any company mentioned. The author has not received compensation for writing this article, other than from FXStreet.
FXStreet and the author do not provide personalized recommendations. The author makes no representations as to the accuracy, completeness, or suitability of this information. FXStreet and the author will not be liable for any errors, omissions or any losses, injuries or damages arising from this information and its display or use. Errors and omissions excepted.
The author and FXStreet are not registered investment advisors and nothing in this article is intended to be investment advice.
Recommended content
Editors’ Picks
AUD/USD posts gain, yet dive below 0.6500 amid Aussie CPI, ahead of US GDP

The Aussie Dollar finished Wednesday’s session with decent gains of 0.15% against the US Dollar, yet it retreated from weekly highs of 0.6529, which it hit after a hotter-than-expected inflation report. As the Asian session begins, the AUD/USD trades around 0.6495.
USD/JPY finds its highest bids since 1990, approaches 156.00

USD/JPY broke into its highest chart territory since June of 1990 on Wednesday, peaking near 155.40 for the first time in 34 years as the Japanese Yen continues to tumble across the broad FX market.
Gold stays firm amid higher US yields as traders await US GDP data

Gold recovers from recent losses, buoyed by market interest despite a stronger US Dollar and higher US Treasury yields. De-escalation of Middle East tensions contributed to increased market stability, denting the appetite for Gold buying.
Ethereum suffers slight pullback, Hong Kong spot ETH ETFs to begin trading on April 30

Ethereum suffered a brief decline on Wednesday afternoon despite increased accumulation from whales. This follows Ethereum restaking protocol Renzo restaked ETH crashing from its 1:1 peg with ETH and increased activities surrounding spot Ethereum ETFs.
Dow Jones Industrial Average hesitates on Wednesday as markets wait for key US data

The DJIA stumbled on Wednesday, falling from recent highs near 38,550.00 as investors ease off of Tuesday’s risk appetite. The index recovered as US data continues to vex financial markets that remain overwhelmingly focused on rate cuts from the US Fed.