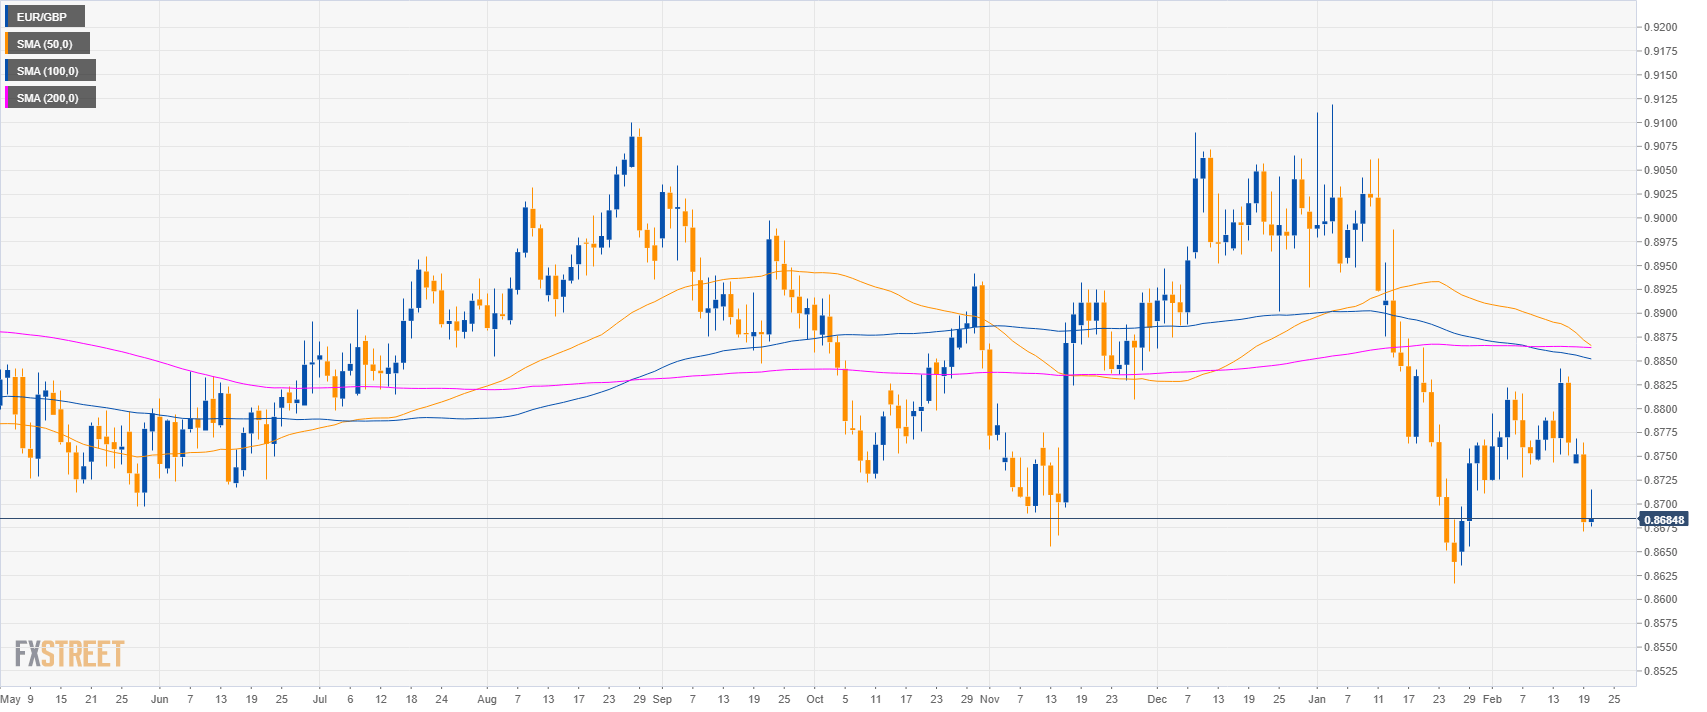
EUR/GBP daily chart
- EUR/GBP is trading in a sideways trend below the 200-day simple moving averages (SMAs).
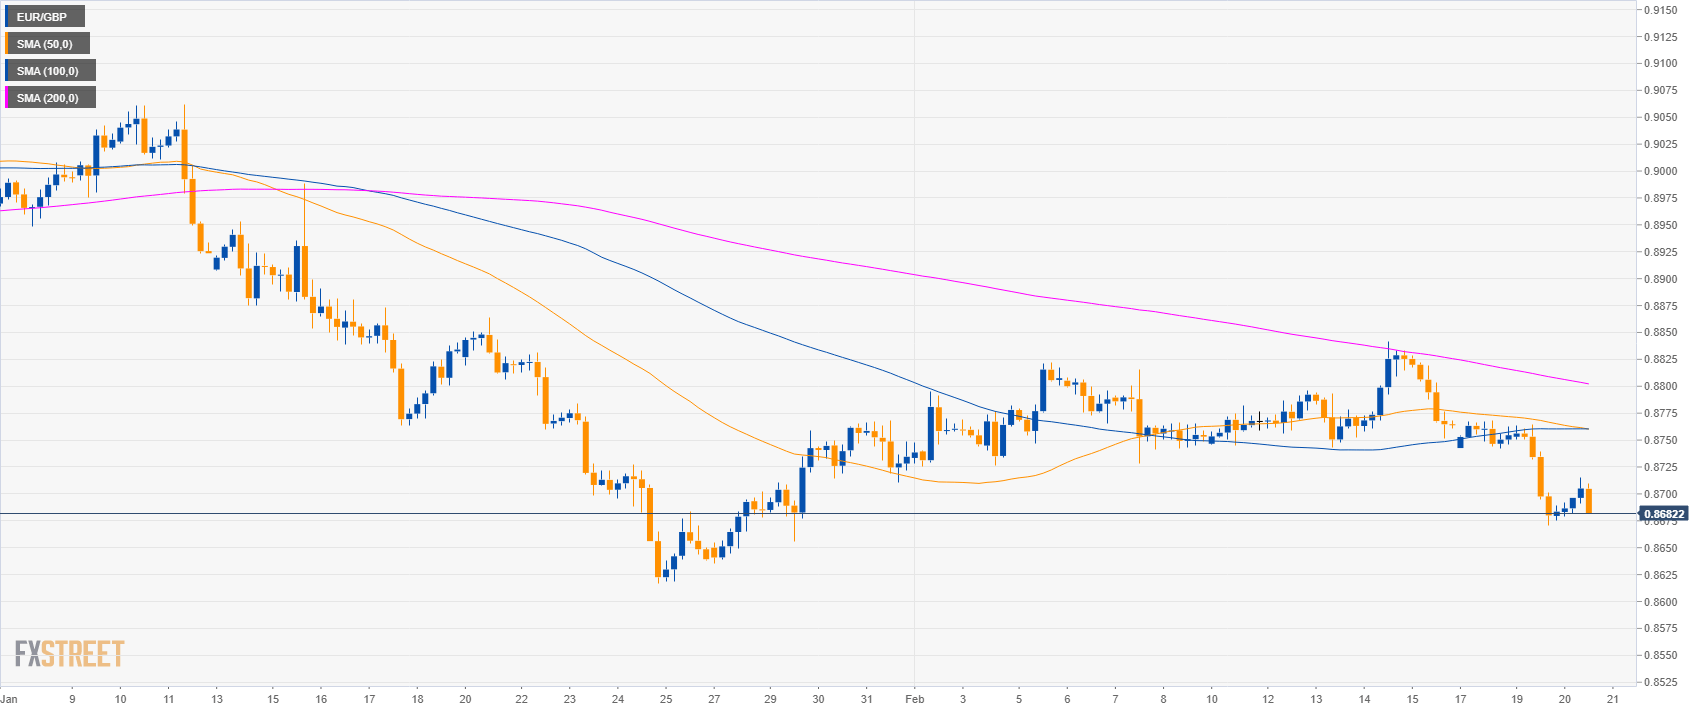
EUR/GBP 4-hour chart
- EUR/GBP is trading below the main SMAs on the 4-hour chart suggesting a bearish market in the medium-term.
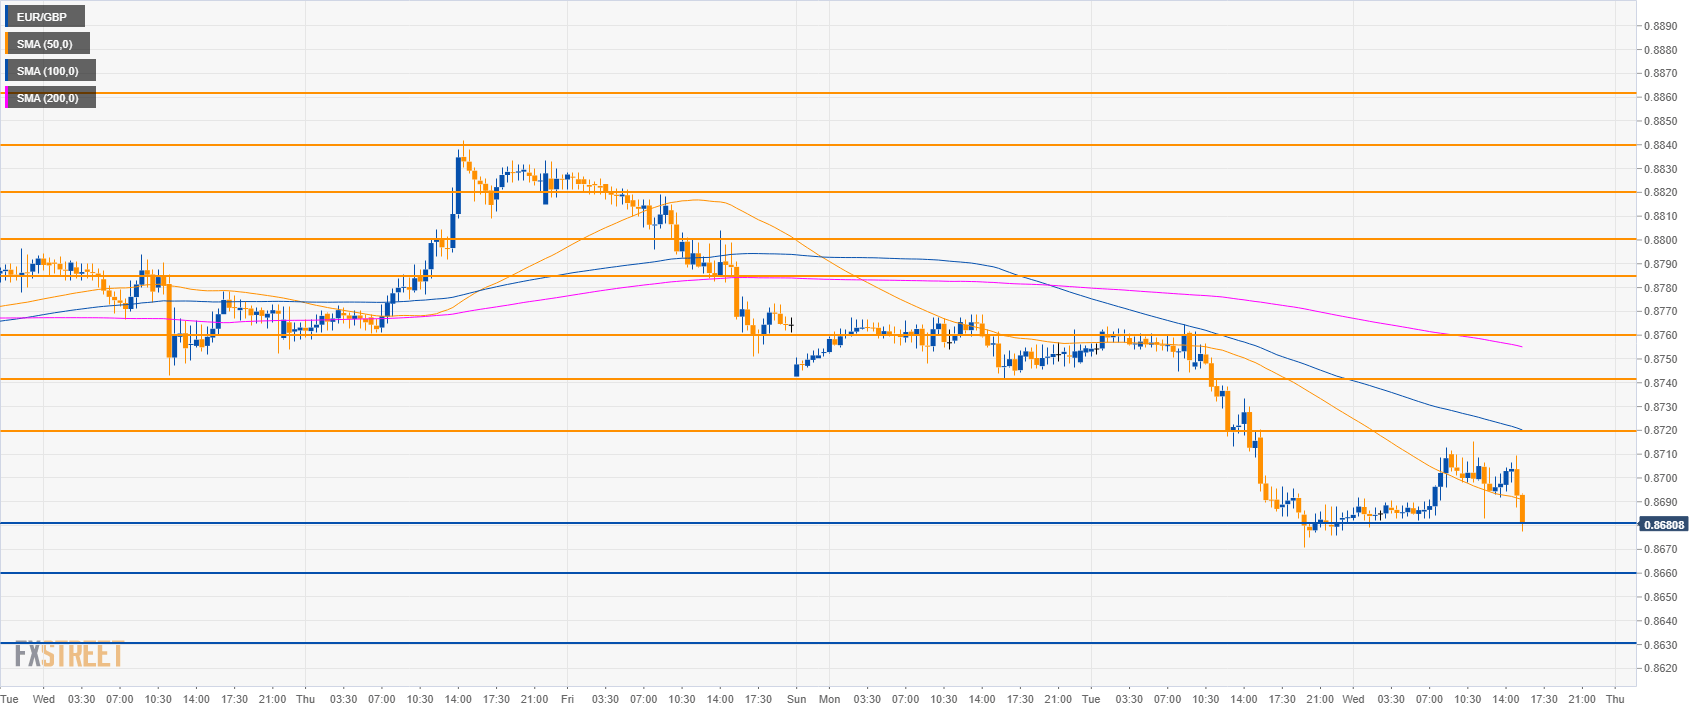
EUR/GBP 30-minute chart
- EUR/GBP is trading below the main SMAs suggesting bearish momentum in the short-term.
- EUR/GBP is testing 0.8680. A break below the level would lead to 0.8660 and 0.8630 level.
- Key resistance is seen at 0.8720 and 0.8760 level.
Additional key levels
EUR/GBP
Overview:
Today Last Price: 0.8693
Today Daily change: 12 pips
Today Daily change %: 0.14%
Today Daily Open: 0.8681
Trends:
Daily SMA20: 0.8745
Daily SMA50: 0.8872
Daily SMA100: 0.8854
Daily SMA200: 0.8864
Levels:
Previous Daily High: 0.8764
Previous Daily Low: 0.8671
Previous Weekly High: 0.8842
Previous Weekly Low: 0.8743
Previous Monthly High: 0.9119
Previous Monthly Low: 0.8617
Daily Fibonacci 38.2%: 0.8707
Daily Fibonacci 61.8%: 0.8729
Daily Pivot Point S1: 0.8647
Daily Pivot Point S2: 0.8612
Daily Pivot Point S3: 0.8553
Daily Pivot Point R1: 0.874
Daily Pivot Point R2: 0.8799
Daily Pivot Point R3: 0.8834
Note: All information on this page is subject to change. The use of this website constitutes acceptance of our user agreement. Please read our privacy policy and legal disclaimer. Opinions expressed at FXstreet.com are those of the individual authors and do not necessarily represent the opinion of FXstreet.com or its management. Risk Disclosure: Trading foreign exchange on margin carries a high level of risk, and may not be suitable for all investors. The high degree of leverage can work against you as well as for you. Before deciding to invest in foreign exchange you should carefully consider your investment objectives, level of experience, and risk appetite. The possibility exists that you could sustain a loss of some or all of your initial investment and therefore you should not invest money that you cannot afford to lose. You should be aware of all the risks associated with foreign exchange trading, and seek advice from an independent financial advisor if you have any doubts.
Recommended content
Editors’ Picks
EUR/USD extends gains above 1.0700, focus on key US data

EUR/USD meets fresh demand and rises toward 1.0750 in the European session on Thursday. Renewed US Dollar weakness offsets the risk-off market environment, supporting the pair ahead of the key US GDP and PCE inflation data.
USD/JPY keeps pushing higher, eyes 156.00 ahead of US GDP data

USD/JPY keeps breaking into its highest chart territory since June of 1990 early Thursday, recapturing 155.50 for the first time in 34 years as the Japanese Yen remains vulnerable, despite looming intervention risks. The focus shifts to Thursday's US GDP report and the BoJ decision on Friday.
Gold closes below key $2,318 support, US GDP holds the key

Gold price is breathing a sigh of relief early Thursday after testing offers near $2,315 once again. Broad risk-aversion seems to be helping Gold find a floor, as traders refrain from placing any fresh directional bets on the bright metal ahead of the preliminary reading of the US first-quarter GDP due later on Thursday.
Injective price weakness persists despite over 5.9 million INJ tokens burned
Injective price is trading with a bearish bias, stuck in the lower section of the market range. The bearish outlook abounds despite the network's deflationary efforts to pump the price.
US Q1 GDP Preview: Economic growth set to remain firm in, albeit easing from Q4

The United States Gross Domestic Product (GDP) is seen expanding at an annualized rate of 2.5% in Q1. The current resilience of the US economy bolsters the case for a soft landing.