


USD/BRL TECHNICAL STRATEGY: BEARISH
- USD/BRL skyrocketed through key resistance level at 3.8140
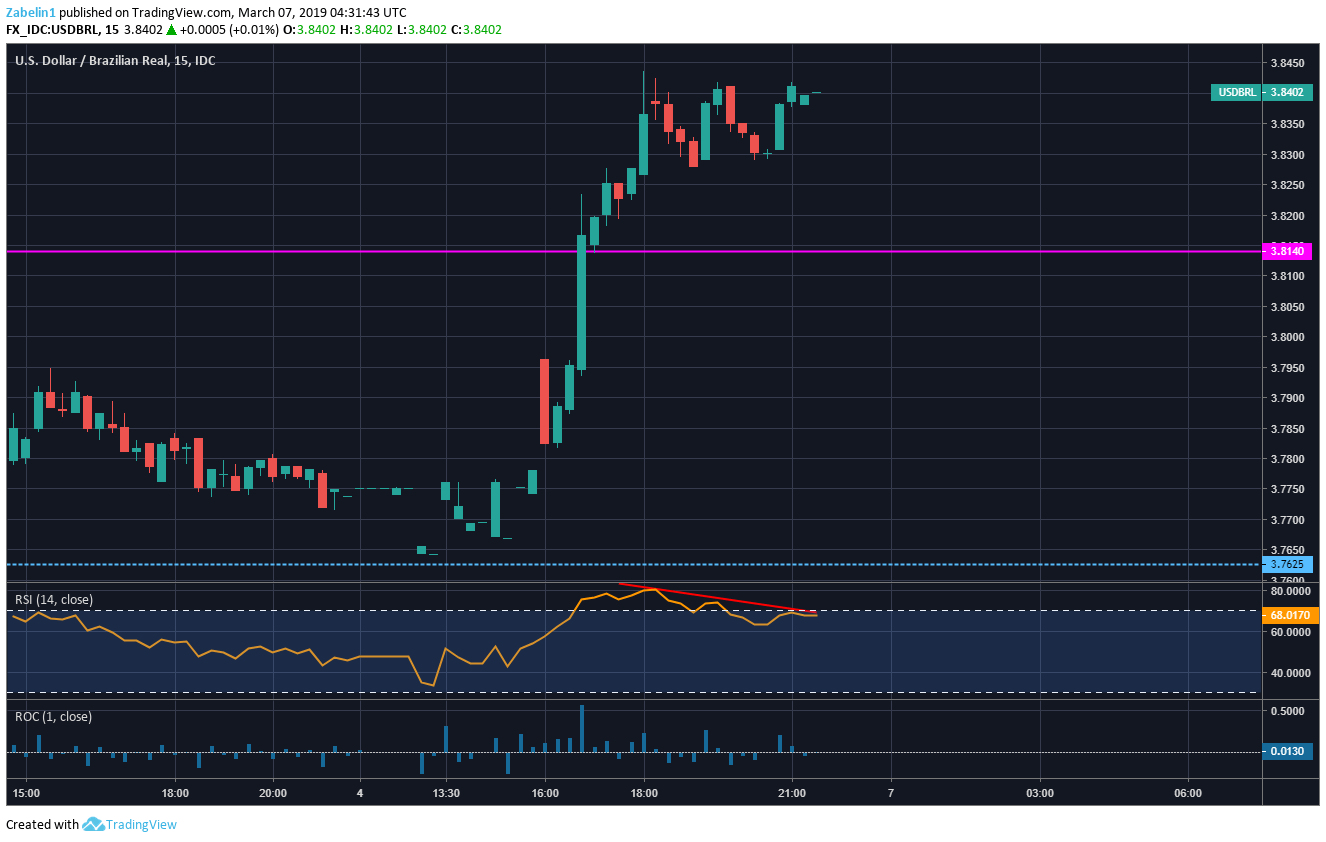
- Negative RSI divergence indicates upside momentum fading
- Re-testing 3.8140 support crucial to determine market outlook
See our free guide to learn how to use economic news in your trading strategy !
Since March 1, USD/BRL has jumped over two percent, blasting through a key resistance at 3.8140 and is within spitting distance of an intimidating psychological barrier at 3.8504. However, negative RSI divergence is signaling a potential short-term fall as upside momentum appears to be fading.
USD/BRL – 15-Minute Chart
The dramatic spike could be the result of thin liquidity caused by the Brazilian Carnival holiday which kept the Stock market in Sao Paulo closed on March 4 and 5. When traders returned the following day, the pair gapped higher to account for market developments that occurred over the holiday which pushed USD higher. This can be seen with a Dollar-weighted index that rose while Brazilian markets were closed.
USD/BRL, Dollar-Weighted Index – 15-Minute Chart

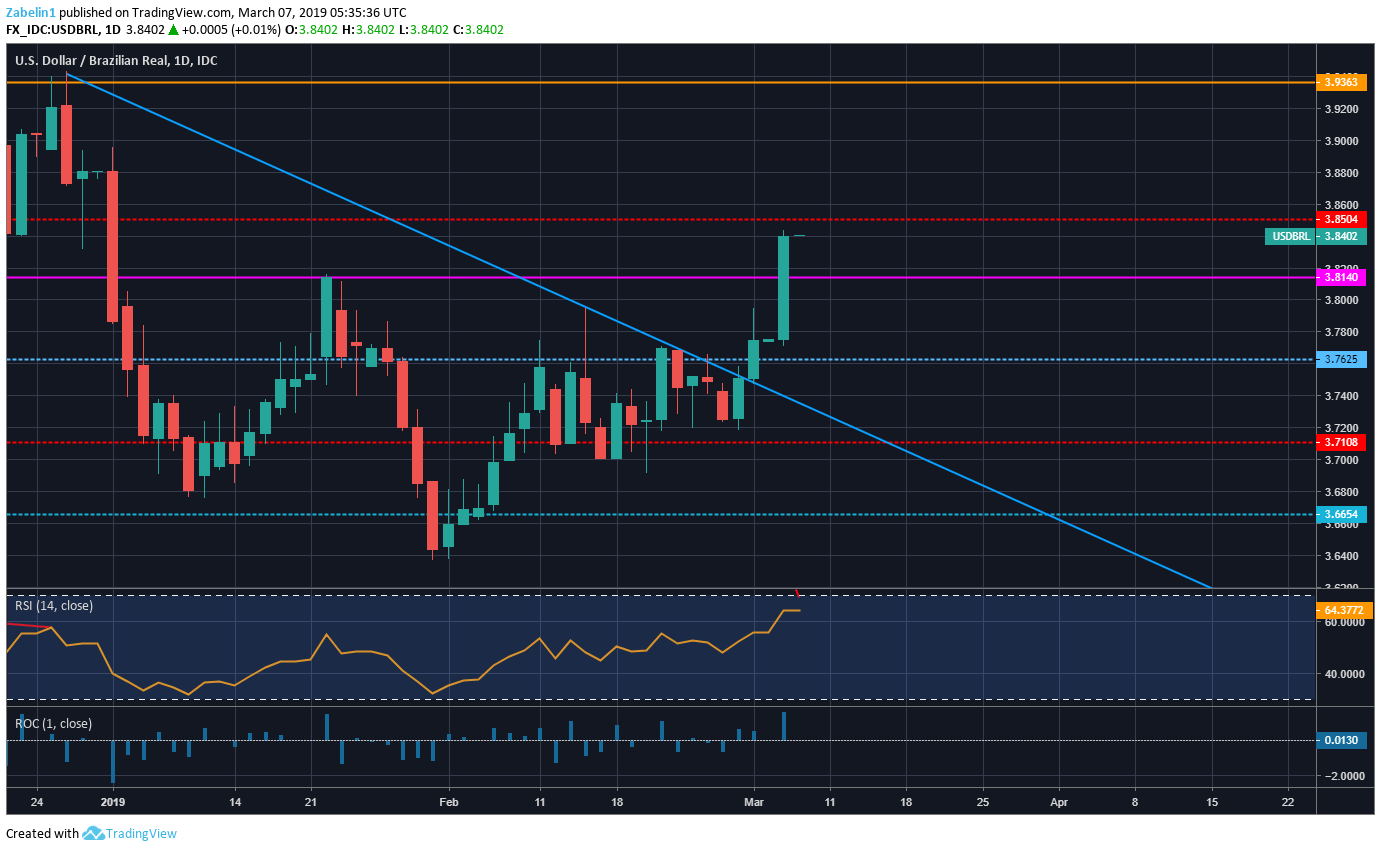
Re-testing the support at 3.8140 will be a crucial indicator of investor sentiment. If it breaks the support, re-tests it and fails to breach, it could signal that investors are not yet ready to be bullish above this level. However, if it is re-tested and it bounces, a that may speak to an underlying bullish sentiment that may take the pair beyond 3.8504 and toward the next psychological wall at 3.9363.
USD/BRL – Daily Chart
To learn about the fundamental factors driving Brazilian assets, be sure to read my USD/BRL forecast for 2019 and follow me at @ZabelinDimitri.
USD/BRL TRADING RESOURCES
- Join a free Q&A webinar and have your trading questions answered
- Just getting started? See our beginners’ guide for FX traders
- Having trouble with your strategy? Here’s the #1 mistake that traders make
--- Written by Dimitri Zabelin, Jr Currency Analyst for DailyFX.com
To contact Dimitri, use the comments section below or @ZabelinDimitri on Twitter


