
Home Depot (HD 0.74%) executives are about as bullish as they've ever been on their home-improvement business. In late February, the company affirmed its long-term outlook that calls for sales to reach as high as $120 billion by 2020 -- just three years after cracking $100 billion for the first time. The company generated "just" $66 billion in fiscal 2010.
That's an aggressive forecast given all the uncertainty around the housing market. Home Depot's short-term results are also highly sensitive to broader economic shifts and to unseasonable wet or snowy weather.

Image source: Getty Images.
Yet CEO Craig Menear and his management team have plenty of support for their optimistic reading of the business that investors can see through a few key charts that describe its latest operating results.
1. Market share

HD Revenue (TTM) data by YCharts.
A rare stumble in the fourth quarter put Home Depot's revenue growth just a tad shy of management's upgraded targets, with comparable-store sales gains landing at 5.2% rather than 5.5%. The company blamed a string of wet-weather events that delayed construction projects for the late-year shortfall.
In any case, the 2018 result marked an impressive achievement for a few reasons. First, it was solidly above rival Lowe's (LOW 0.63%) expansion rate. Home Depot also added to its market share gains despite a tough sales comparison. The 2017 year, after all, included a big lift from hurricane rebuilding efforts. But the retailer managed to follow up that 7.5% sales spike with just a minor deceleration to 5.2% in 2018.
Check out the latest earnings call transcript for Home Depot.
2. Operating income
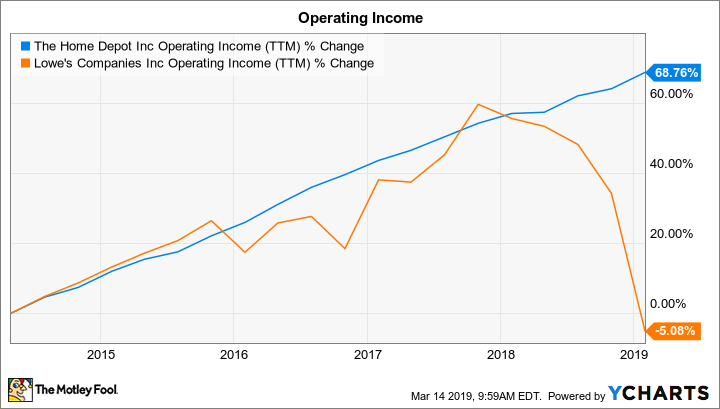
HD Operating Income (TTM) data by YCharts.
Home Depot's product leadership approach helped lift gross profitability last year, which took nearly all the sting away from rising spending in areas like e-commerce and employee wages. As a result, operating income rose 6%, or by just slightly less than overall sales. That translates into an operating margin of 14.4% of sales compared to 14.5% a year earlier. Lowe's comparable figure was temporarily lowered by charges that the retailer took in conjunction with its restructuring plan. However, Home Depot's long-term outperformance in this area is clear. Executives are predicting a stable year ahead for margins, too, with operating income holding at 14.4%, while Lowe's is projected to stay in the high single digits.
3. Financial wins

HD Return on Invested Capital (TTM) data by YCharts.
Add market share gains to healthy profitability and a falling tax rate, and you've got a formula for impressive financial returns. Cash flow passed $13 billion in 2018 compared to $12 billion in the prior year. Home Depot's return on invested capital jumped by more than 10 percentage points to 45% during the year.
This success has given management more firepower it can direct toward its long-term growth initiatives. For 2019, these include adding new stores to the base for the first time in years and spending heavily on the e-commerce infrastructure. Investors can expect these moves to lead to lower direct cash returns compared to 2018's roughly $15 billion outlay from stock buybacks and dividend payments.
As of late February, management is predicting another record sales year ahead, with growth holding at roughly 5% and profitability again trouncing industry peers. This forecast comes with all the usual caveats, including potential downturns in the economy or rough-weather patches that might hit during the peak spring selling season. Yet Home Depot has handily navigated similar challenges in recent years, so investors should have some confidence in management's bullish long-term goals.


