


NORDIC FX, SEK, NOK - WEEKLY MARKET OUTLOOK
- USD/SEK, USD/NOK broke key support levels
- Broader trajectory for pairs remains on upside
- FOMC, Norges Bank likely to cause volatility
See our free guide to learn how to use economic news in your trading strategy !
SWEDISH KRONA TECHNICAL ANALYSIS
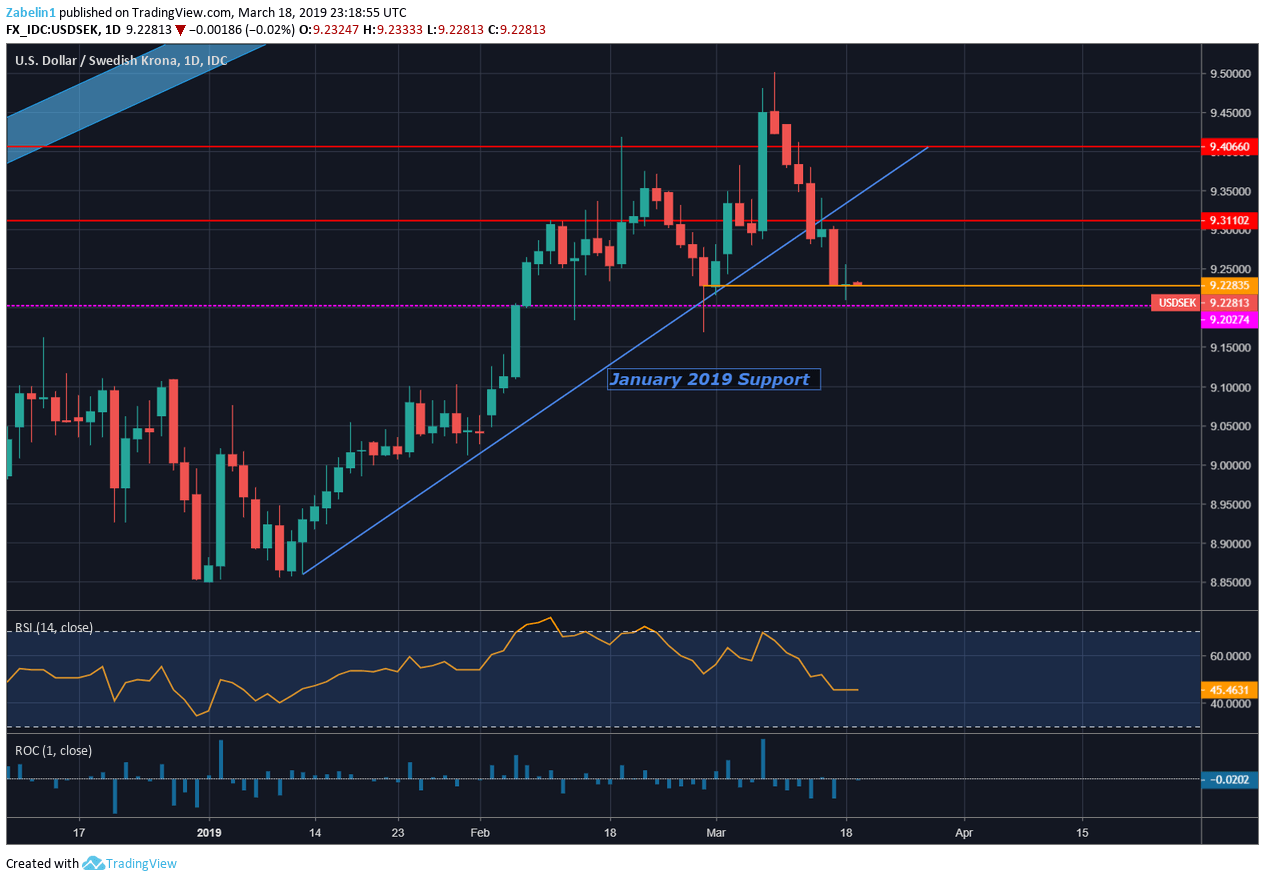
Last week, US Dollar weakness appeared to have been the catalyst in dragging down USD/SEK below the January 2019 rising support line. The pair is now sitting on the frequently-tested 9.2283 support. Another bounce from this level might show that overall sentiment for the pair still remains broadly bullish. The pair’s aim may now be on breaching resistance at 9.3110 and using that as the new floor if prices turn lower again.
USD/SEK – Daily Chart
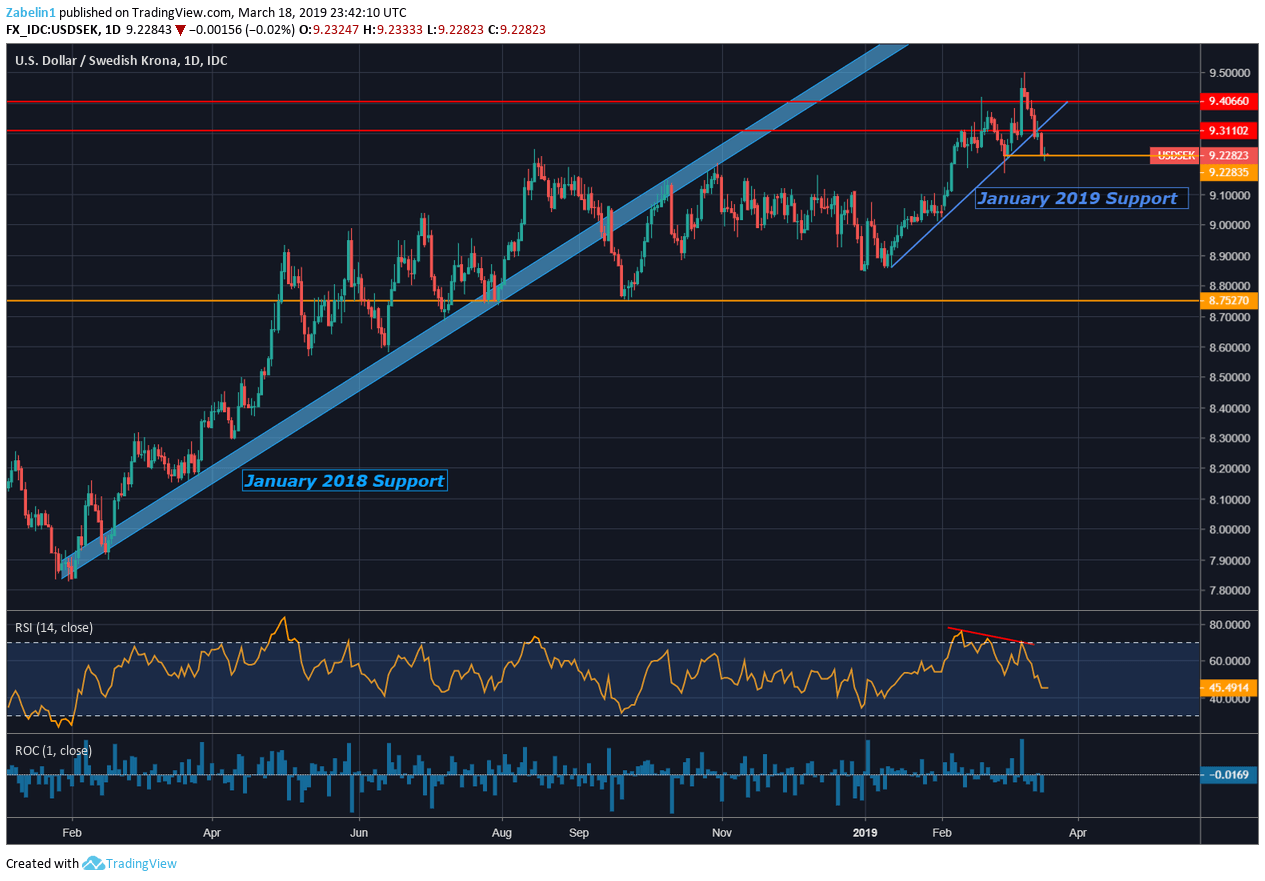
Zooming out, the pair’s overall trajectory since the start of 2018 has showed a broad uptrend. The January 2018 support provided a strong foundation for the pair to ride on until its break in September. USD/SEK then broke into consolidation before trying to re-enter the rising support range from the beginning of 2018. However, underlying momentum failed to push the pair through it. What followed was a congestive period of indecision.
However, in 2019, the pair resumed its previous upward trajectory, and went on to achieve a 17-year high in early March. USD/SEK’s atmosphere-puncturing rise was subsequently faded as negative RSI divergence illustrated ebbing upward momentum and US Dollar weakness prevailed. Despite a small pullback, fundamental factors suggest the pair will continue to climb.
USD/SEK – Daily Chart
NORWEGIAN KRONE TECHNICAL ANALYSIS
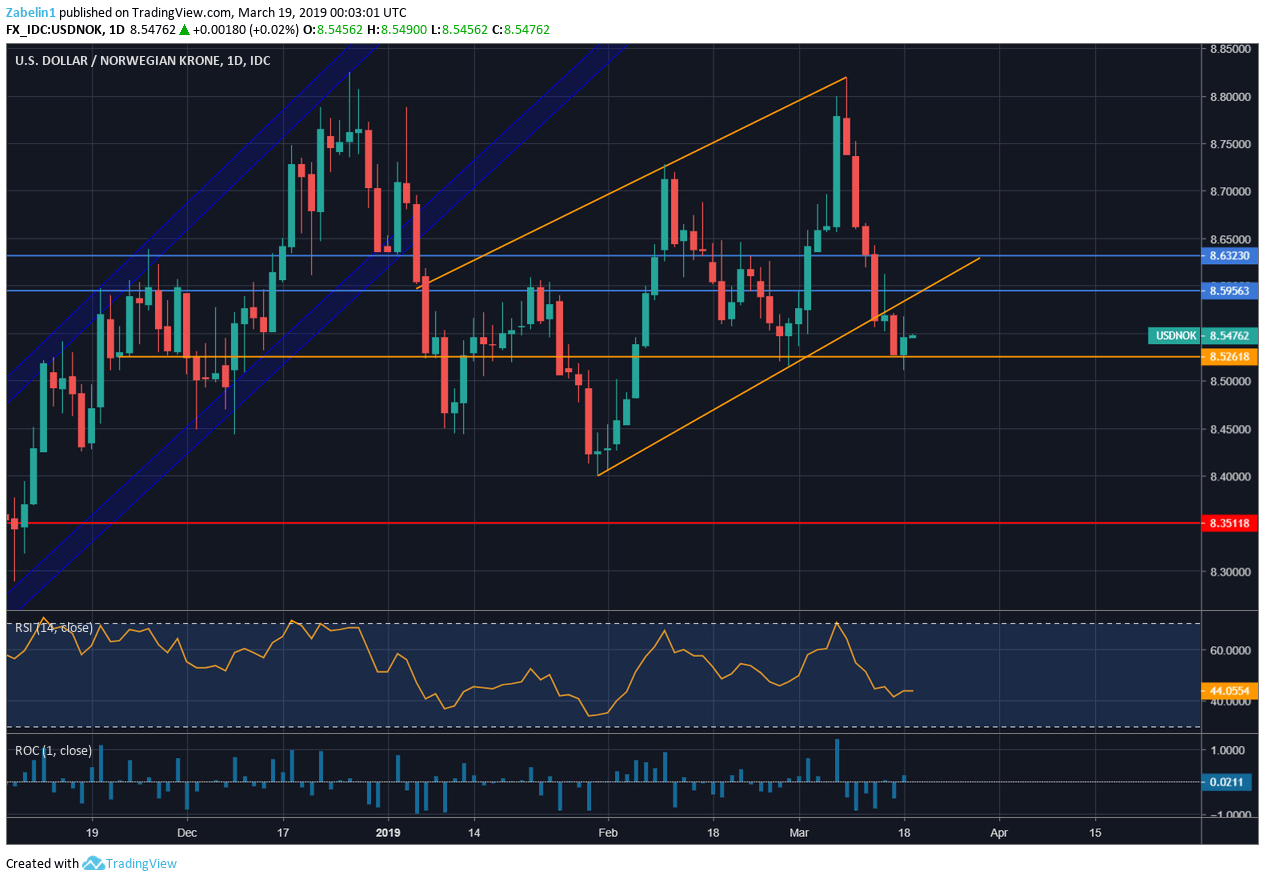
USD/NOK also recently broke through a key support level in what also appears to be the result of broad US Dollar weakness. The pair’s descent looks to have been abruptly ended after bouncing back from the familiar support at 8.5261, a strong psychological floor. The pair’s aim may be to first re-enter the 8.5956-8.6323 resistance range before maybe resuming its previous incline.
USD/NOK – Daily Chart
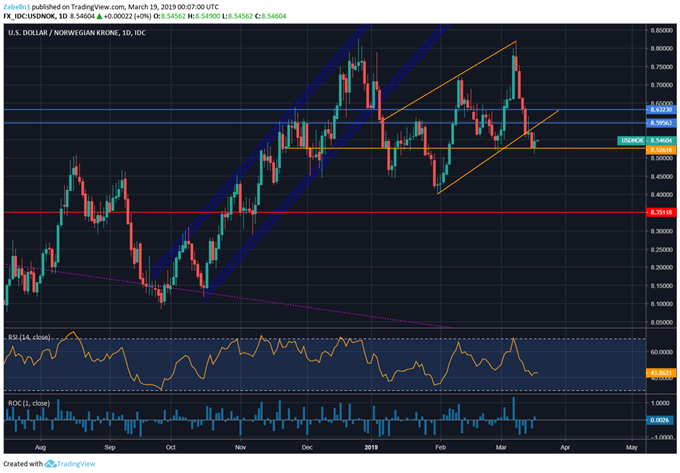
Like USD/SEK, USD/NOK appears to be only having a small pullback from what looks like a broader uptrend originally starting from the sharp incline in September 2018. The pair broke through in early-January but then promptly resumed the previous uptrend at a less aggressive pace. The pair will likely continue to climb through the rest of the week, but central bank-related events may cause short-term volatility as markets price in a new outlook.
USD/SEK – Daily Chart
SWEDISH KRONA, NORWEGIAN KRONE TRADING RESOURCES
- Join a free Q&A webinar and have your trading questions answered
- Just getting started? See our beginners’ guide for FX traders
- Having trouble with your strategy? Here’s the #1 mistake that traders make
--- Written by Dimitri Zabelin, Jr Currency Analyst for DailyFX.com
To contact Dimitri, use the comments section below or @ZabelinDimitri on Twitter


