
Advertisement
Advertisement
E-mini S&P 500 Index (ES) Futures Technical Analysis – March 21, 2019 Forecast
By:
Based on the current price at 2820.75, the nearest resistance angle is 2842.75 and the nearest support angle is 2798.50.

June E-mini S&P 500 Index futures are expected to open lower based on the pre-market trade. The price action suggests that investors may have already discounted the Fed’s dovish monetary policy decisions and are now ready to move on to other key issues like Brexit, U.S.-China trade relations and the U.S. economy.
At 13:07 GMT, June E-mini S&P 500 Index futures are trading 2820.75, down 6.25 or -0.23%.
In other news, a 26 percent drop in shares of Biogen is also weighing on prices ahead of the opening. Furthermore, U.S.-China trade relations are also a concern due to the lack of progress towards a deal.
Daily Technical Analysis
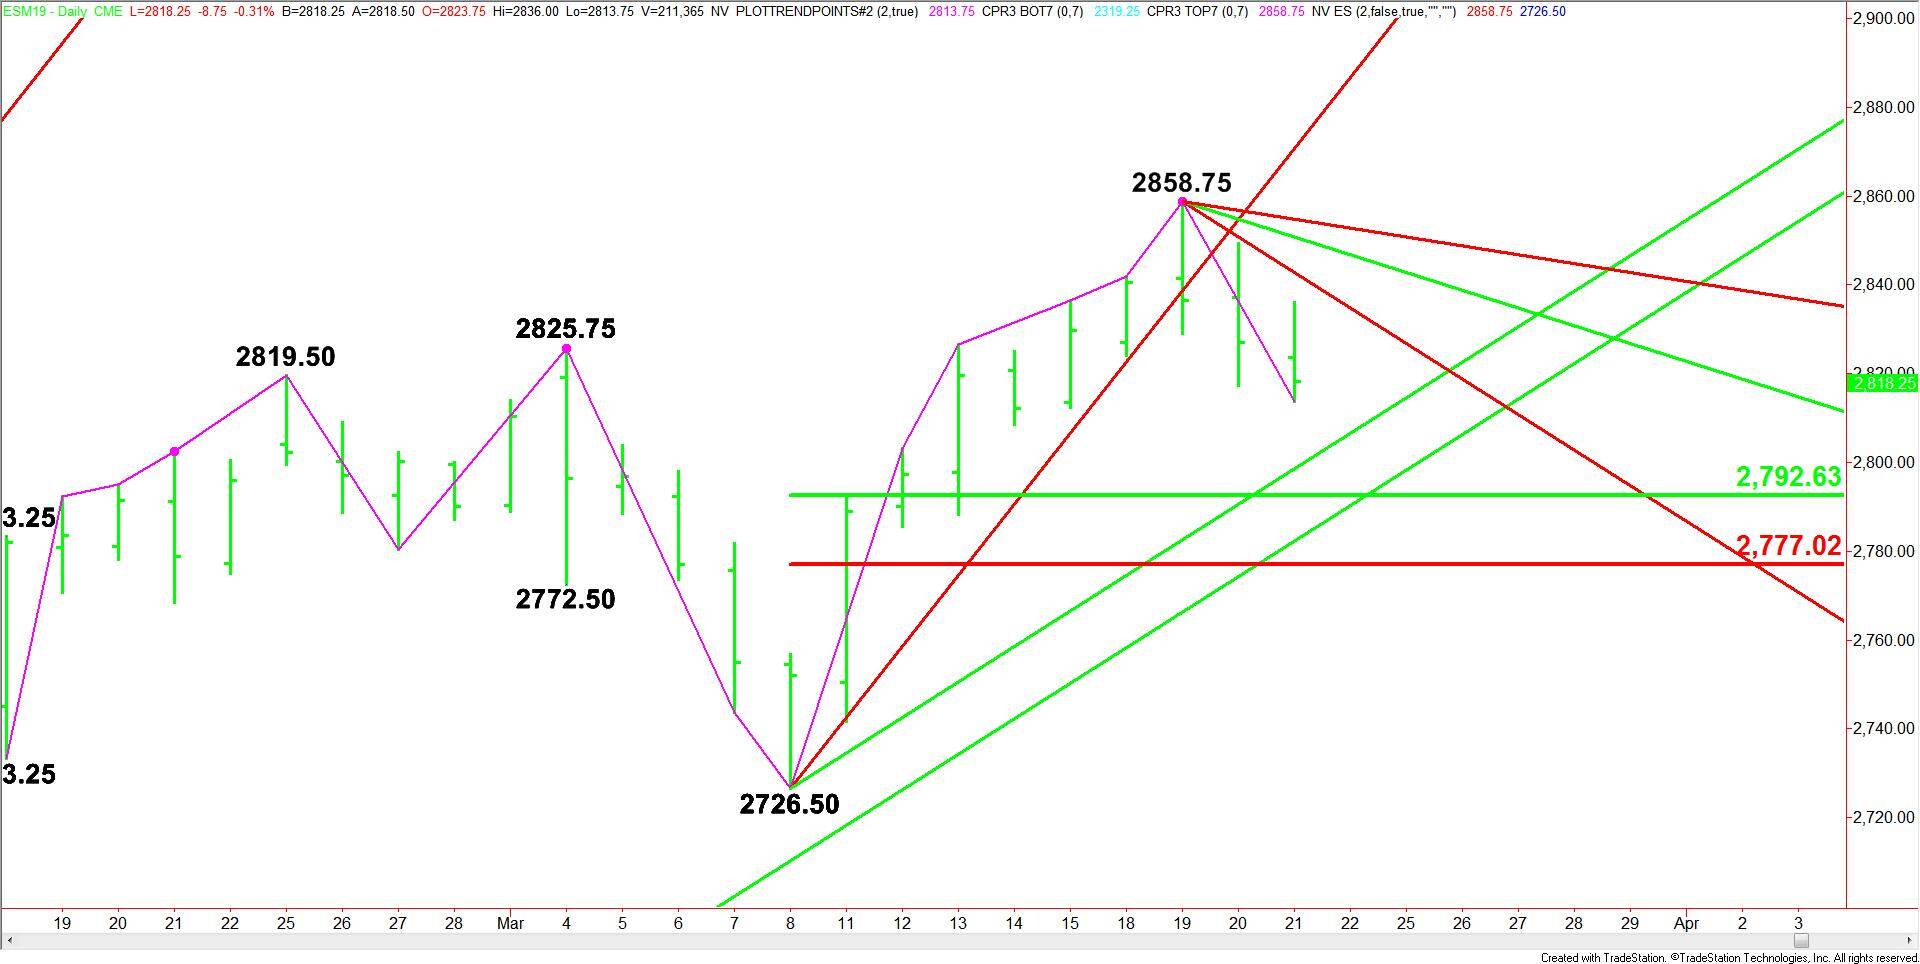
The main trend is up according to the daily swing chart. However, momentum has been trending lower since the formation of the closing price reversal top at 2858.75 on Tuesday. This chart-term typically leads to a 2 to 3 day correction.
A trade through 2858.75 will negate the closing price reversal top and signal a resumption of the uptrend. The main trend will officially change to down on a move through 2726.50.
The short-term range is 2726.50 to 2858.75. Its retracement zone at 2792.50 to 2777.00 is the primary downside target. Since the trend is up, look for a technical bounce on the first test of this zone.
Daily Technical Forecast
Based on the current price at 2820.75, the nearest resistance angle is 2842.75 and the nearest support angle is 2798.50.
Bullish Scenario
If buyers take control early in the session then look for a run-up into the downtrending Gann angle at 2842.75. We could see sellers on the first test of this angle, but if it is taken out, then look for a rally into the next angle at 2850.75. Once again, we could see counter-trend sellers emerge. This angle is also the trigger point for a rally into the next downtrending Gann angle at 2854.75.This is the last potential resistance angle before the 2858.75 main top.
Bearish Scenario
If sellers are controlling the price action then they may take a run at the nearest uptrending Gann angle at 2798.00. Look for buyers on the first test of this angle. If it fails as support then look for the selling to extend into the 50% level at 2792.50, followed by the uptrending Gann angle at 2782.50 and the Fibonacci level at 2777.00.
About the Author
James Hyerczykauthor
James is a Florida-based technical analyst, market researcher, educator and trader with 35+ years of experience. He is an expert in the area of patterns, price and time analysis as it applies to futures, Forex, and stocks.
Did you find this article useful?
Latest news and analysis


Advertisement