- Bitcoin cash price surged higher recently and broke the $150 and $162 resistances against the US Dollar.
- The price traded as high as $167 and later corrected lower below the $160 support.
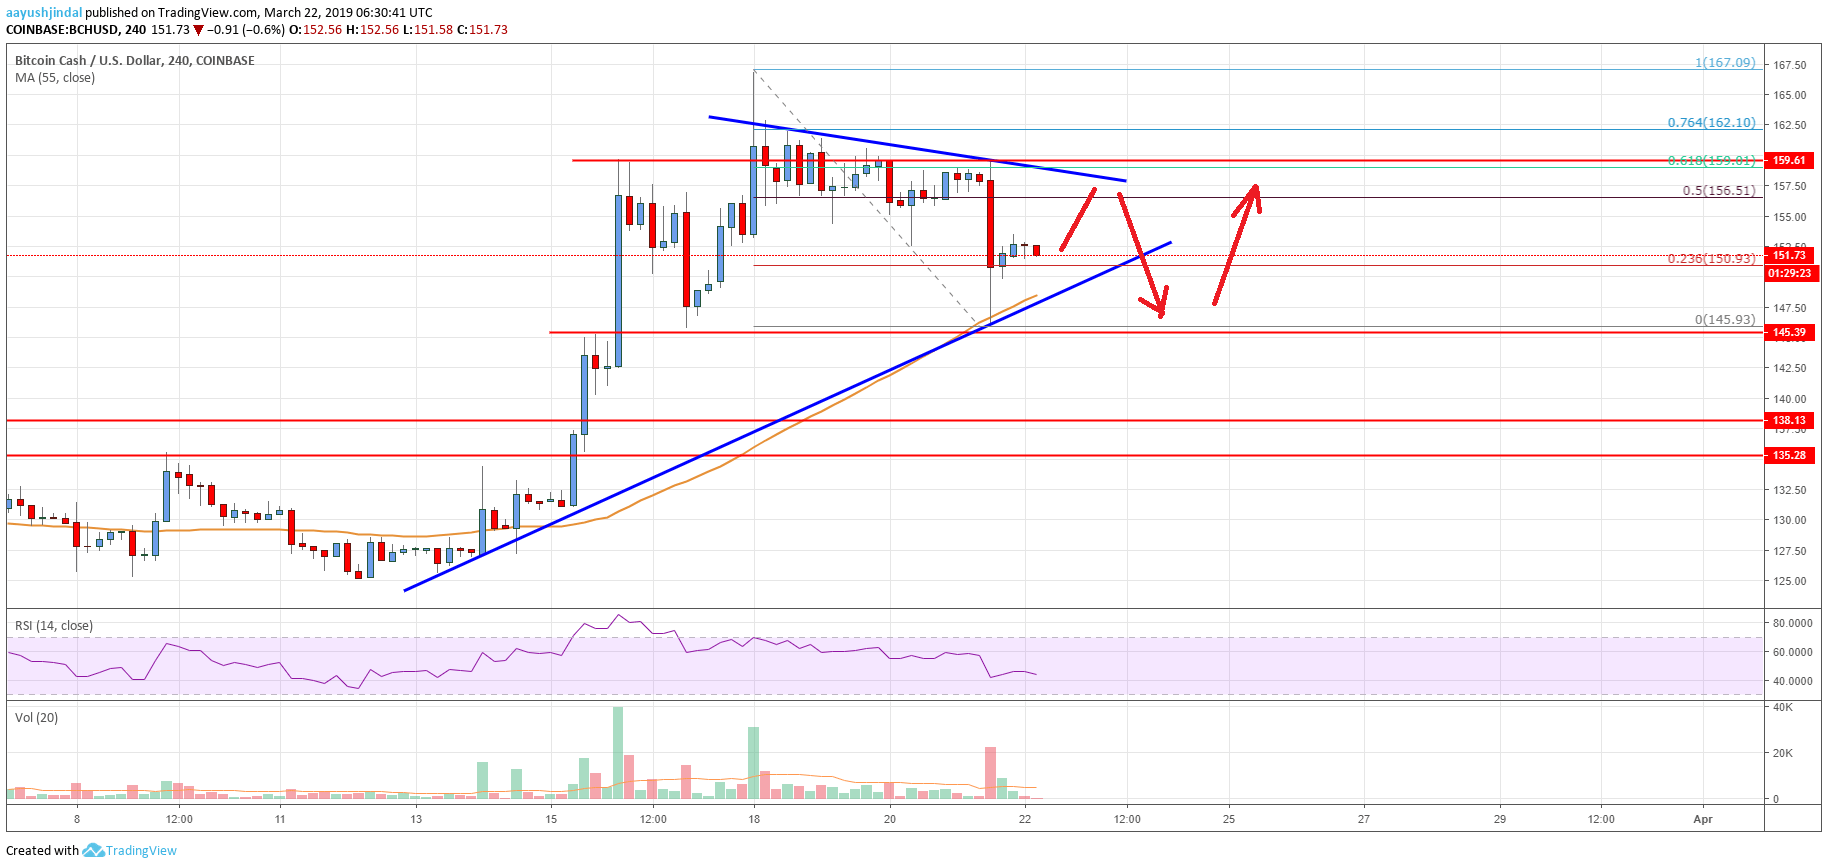
- There is a crucial bullish trend line in place with support at $150 on the 4-hours chart of the BCH/USD pair (data feed from Kraken).
- The pair could decline in the short term, but it remains supported near the $145-146 zone.
Bitcoin cash price rallied recently above $160 before correcting lower against the US Dollar. BCH could tested the $145 support level before a fresh increase in the near term.
Bitcoin Cash Price Analysis
After a decent upward move, there was a sharp correction in bitcoin, ripple, Ethereum, and bitcoin cash against the US Dollar. Earlier, the BCH/USD pair broke the $138 and $140 resistance levels to move into a bullish zone. The price climbed above the $145 and $150 resistance levels. The upward move was strong as the price even broke the $160 barrier and settled above the 55 simple moving average (4-hours). A new monthly high was formed at $167 and later the price corrected lower.
It traded below the $160 and $156 support levels. The recent decline got traction, resulting in a drop below the $150 support. However, the price found support near $146 and the 55 simple moving average (4-hours). Besides, there is a crucial bullish trend line in place with support at $150 on the 4-hours chart of the BCH/USD pair. The pair recovered above the 23.6% Fib retracement level of the recent decline from the $167 swing high to $146 swing low.
However, there are many hurdles on the upside near the $155 and $156 levels. There is also a connecting bearish trend line in place with resistance at $156 on the same chart. The trend line coincides with the 50% Fib retracement level of the recent decline from the $167 swing high to $146 swing low. Therefore, a break above the $155 and $156 resistance levels is must for a fresh upward move.

Looking at the chart, bitcoin cash price is trading above key supports such as $150 and $145. It may climb higher, but it could struggle near the $155-156 resistance zone. Therefore, there is a risk of another drop towards the $145 support before the price starts a decent upward move. On the upside, a break above $156 might push the price towards $162 and $167.
Technical indicators
4 hours MACD – The MACD for BCH/USD is currently placed in the bearish zone.
4 hours RSI (Relative Strength Index) – The RSI for BCH/USD is now well above the 50 level, with a bearish angle.
Key Support Levels – $150 and $145.
Key Resistance Levels – $156 and $162.


