


Forex Setups for the Week of March 25, 2019
Forex Talking Points:
- DailyFX Quarterly Forecasts are available directly from the following link: DailyFX Trading Guides, Q1 Forecasts.
- For trading ideas, please check out our Trading Guides. And if you’re looking for something more interactive in nature, please check out our DailyFX Live webinars.
- If you’d like more color around any of the setups below, join in our live DailyFX webinars each week, set for Tuesday and Thursday at 1PM Eastern Time. You can sign up for each of those sessions from the below link:
Tuesday: Tuesday, 1PM ET
Thursday: Thursday 1PM ET
Do you want to see how retail traders are currently trading the US Dollar? Check out our IG Client Sentiment Indicator.
Risk Aversion Potential Rears Ahead of the End of Q1
It’s been a busy week across FX-land and, well, a number of other markets as well. The US Dollar finished traversing the entirety of the ascending triangle formation that’s been building for the past few months. Still, no break has shown as sellers pushed from resistance earlier this month to elicit a support test around the FOMC rate decision earlier this week. The day after that rate decision saw a decisive risk-on tone through global equity markets; but under the surface there were a few signs of concern, mainly with continued strength on bond prices, particularly on the shorter-end of the curve. This brought upon yield curve inversion in US treasuries on Friday morning, and for the first time since 2007 – the 3-month T-Bill yielded more than that of the 10-year Treasury.
This would be like a regular person going to a bank for a loan, and the bank asking for a higher interest rate on the payback of a three-month-loan than a 10-year loan. Sounds strange, doesn’t it? The longer-term loan would bring on considerably more risk, approximately 40 times longer than the three-month-loan, and this is pretty much why it never happens, at least on the consumer-level. This does happen in markets from time-to-time, and its often indication of extreme stress. It is, however, a lousy timing tool, as the yield curve can grow even more inverted and there are no assurances of a direct market response. Moreover, the more solid signals from yield curve inversion usually involve the curve stayinginverted for some time.
With this in mind, the final week of Q1 awaits, and there may be some new themes for traders to work with after what was a strong showing for the risk-off trade to kick-off 2019. Below, I look at three price action setups of interest as the end of the first quarter nears.
EURJPY Breakdown Potential
While EURUSD remains mired in the multi-month range, EURJPY posed a visible downside breakout on Friday as both Euro-weakness and Yen-strength compelled a noticeable move on the chart. If risk aversion themes do continue, as seen in the post-FOMC backdrop this week, the short-side of EURJPY can remain of interest.
The primary concern at this point are the short-term oversold conditions currently showing in the pair. Prices have found a bit of support around the same 123.80-level that had held the lows in late-January, and bears may be a bit stretched at this point. This leaves two possible manners of approach: Either a pullback to find resistance at prior support, at which bearish trend strategies can become favored. Or, a down-side break through current support with nearby targets to allow for break-even stops and initial scale-outs.
For the pullback approach, the area around 125.00 remains of interest. This area offered around three weeks of resistance in the pair in late-January as the bear flag was building, eventually becoming support in later-February. The current break-down saw prices shred right through this level, so a pullback with sellers responding to show resistance at this key area on the chart can re-open the door for bearish strategies.
EURJPY Daily Price Chart
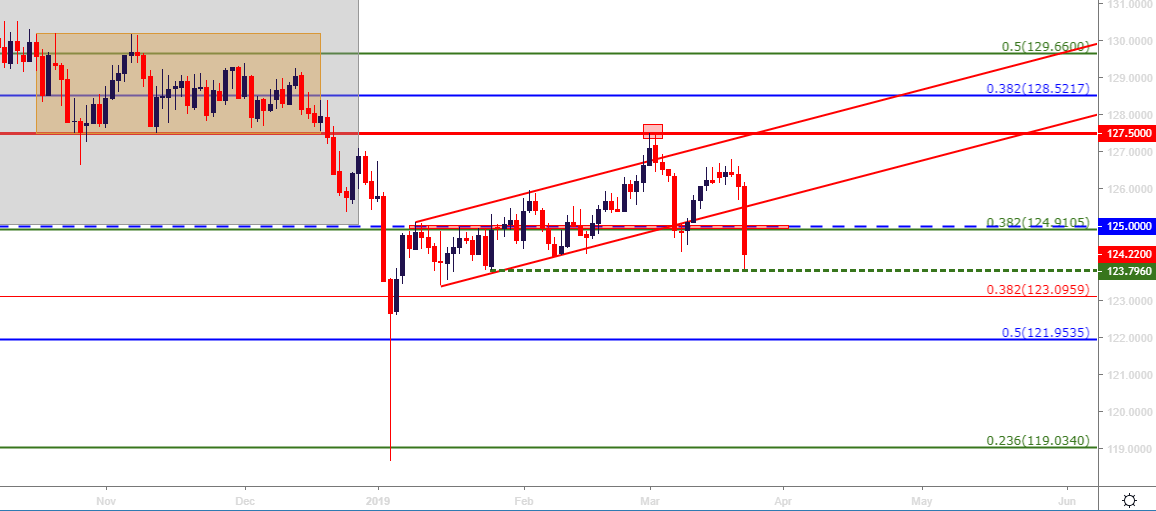
Chart prepared by James Stanley
For the breakout approach, prices are currently holding around the late-January swing-lows; and a bit-lower on the chart is a Fibonacci level around 123.10 that can be used for initial targets, at which point stop moves to break-even can be investigated, along with secondary targets around the 122-area.
EURJPY Four-Hour Price Chart
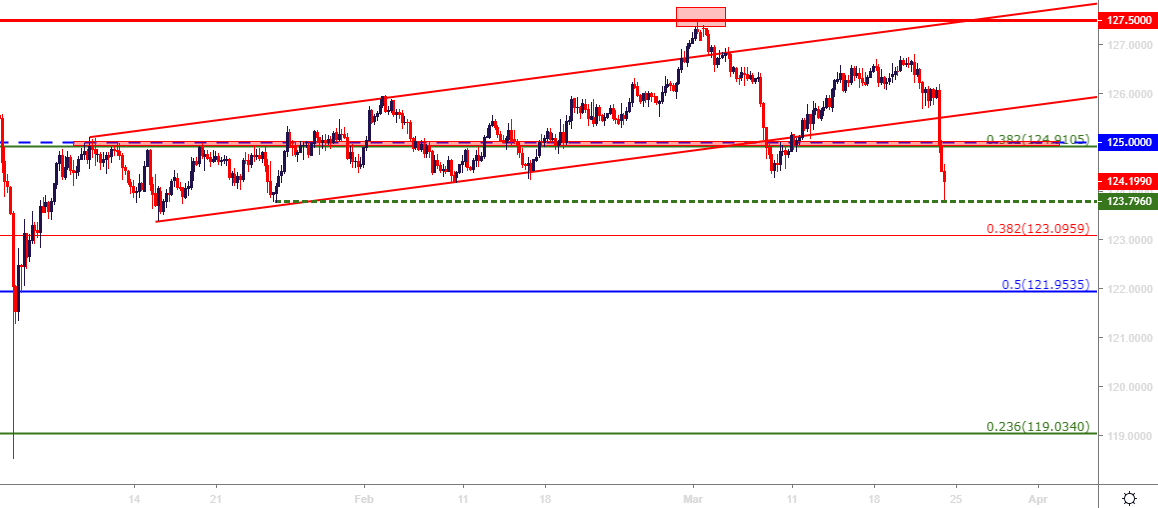
Chart prepared by James Stanley
USD Weakness Strategy: Bearish USDCAD on Hold Below 1.3470
In last week’s FX Setups, I looked at short-side USDCAD setups on the basis of resistance around 1.3361-1.3385 and initial targets around 1.3236-1.3259. That setup filled-in fairly quickly and the first target was traded at on Tuesday of this week. Prices returned for a re-test of support on Wednesday around the FOMC rate decision; but the ensuing response of USD-strength saw prices in the pair run-up to fresh weekly highs, finding a bit of resistance at the Fibonacci level around 1.3423.
Prices remaining inside of the March swing-high of 1.3470 keeps the door open for short-side swing potential, particularly for those looking to take on short-USD exposure. Target potential exists at 1.3361, 1.3325 and then again around the 1.3236-1.3259 zone. If bears can punch down to fresh lows next week, the door opens for a re-test of the 1.3132 level, which I had previously looked at for bullish reversals ahead of the March open.
USDCAD Four-Hour Price Chart
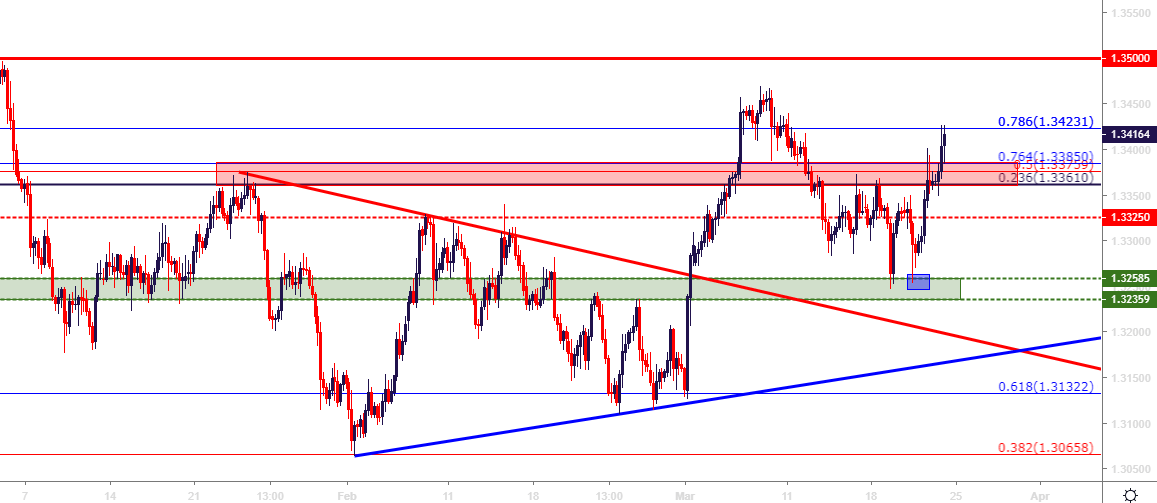
Chart prepared by James Stanley
USD Strength Strategy: Bearish NZDUSD on Hold Below .6950
Similar to the above in USDCAD but on the other side of the US Dollar, NZDUSD caught a strong bid to rally up towards a big zone of long-term resistance. Prices on Wednesday and Thursday carved-out a high on a trend-line projection that makes up a symmetrical wedge formation; and given close proximity to the .7000 big-figure, buyers may have a difficult time pushing up to fresh highs outside of any exogenous influences.
This can keep the door open for short-side swing-setups in the pair, targeting a re-test of the .6820 Fibonacci level at which point break-even stop moves can be investigated. Additional target potential exists around .6750-.6766, around the bullish trend-line projection that makes up the bottom-side of that symmetrical wedge; and if that breaks, the door can soon re-open for tests of the .6600 and .6500 psychological levels.
NZDUSD Daily Price Chart
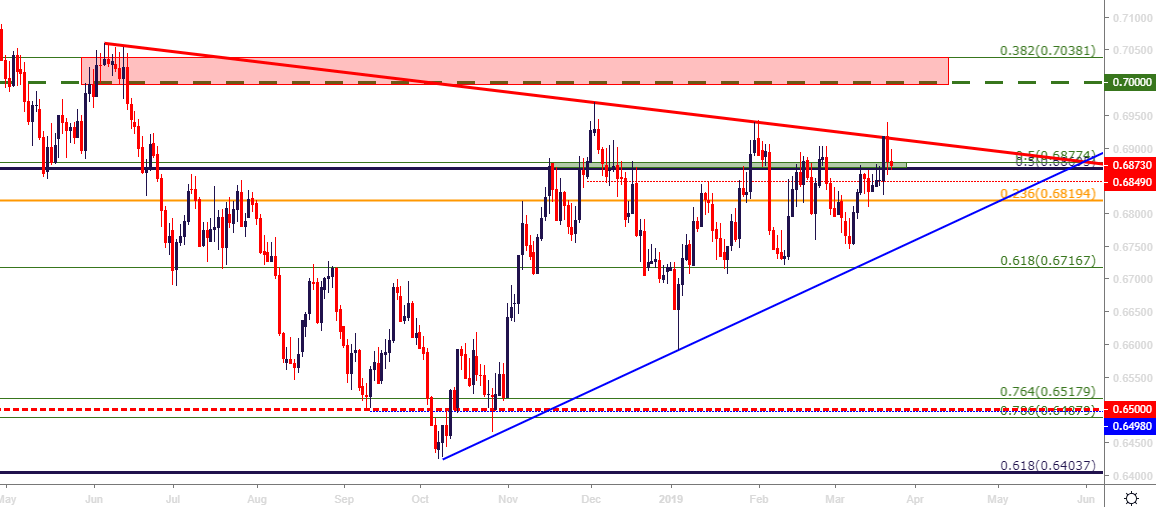
Chart prepared by James Stanley
To read more:
Are you looking for longer-term analysis on the U.S. Dollar? Our DailyFX Forecasts have a section for each major currency, and we also offer a plethora of resources on USD-pairs such as EUR/USD, GBP/USD, USD/JPY, AUD/USD. Traders can also stay up with near-term positioning via our IG Client Sentiment Indicator.
Forex Trading Resources
DailyFX offers a plethora of tools, indicators and resources to help traders. For those looking for trading ideas, our IG Client Sentiment shows the positioning of retail traders with actual live trades and positions. Our trading guides bring our DailyFX Quarterly Forecasts and our Top Trading Opportunities; and our real-time news feed has intra-day interactions from the DailyFX team. And if you’re looking for real-time analysis, our DailyFX Webinars offer numerous sessions each week in which you can see how and why we’re looking at what we’re looking at.
If you’re looking for educational information, our New to FX guide is there to help new(er) traders while our Traits of Successful Traders research is built to help sharpen the skill set by focusing on risk and trade management.
--- Written by James Stanley, Strategist for DailyFX.com
Contact and follow James on Twitter: @JStanleyFX


