


FOREX MARKET IMPLIED VOLATILITY – TALKING POINTS
- Currency volatility has been on the rise lately with GBPUSD 1-week implied volatility resting near 32-month highs amid the latest Brexit uncertainty
- Across the forex market, technical confluence conjoins upcoming event risk and looks to have potential for sizable price action for GBP, USD, EUR, JPY and CAD currency pairs
- New to forex trading? Check out these free educational guides on Forex for Beginners and How to Trade the News to sharpen your skills as a trader
The currency market has seen an influx of price action since last week’s implied volatility report as a whirlwind of central bank decisions, economic data releases and Brexit headlines sent major forex pairs gyrating. Currency option traders have bid up hedging costs across the market and is reflected by rising 1-week implied volatilities. With volatility ticking higher in addition to threatening event risk on deck, what currency pairs are likely to see heightened price action for the week ahead?
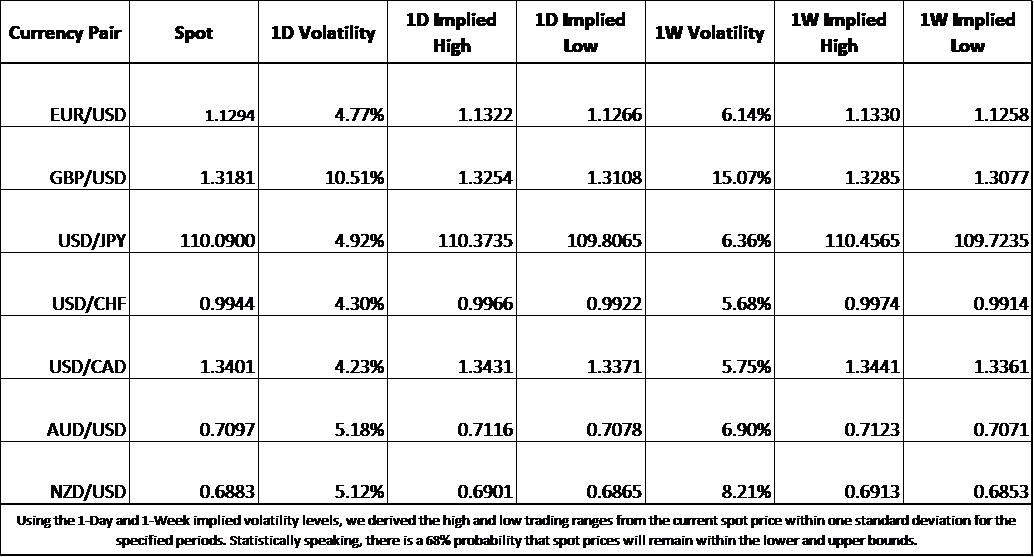
FOREX MARKET IMPLIED VOLATILITIES AND TRADING RANGES
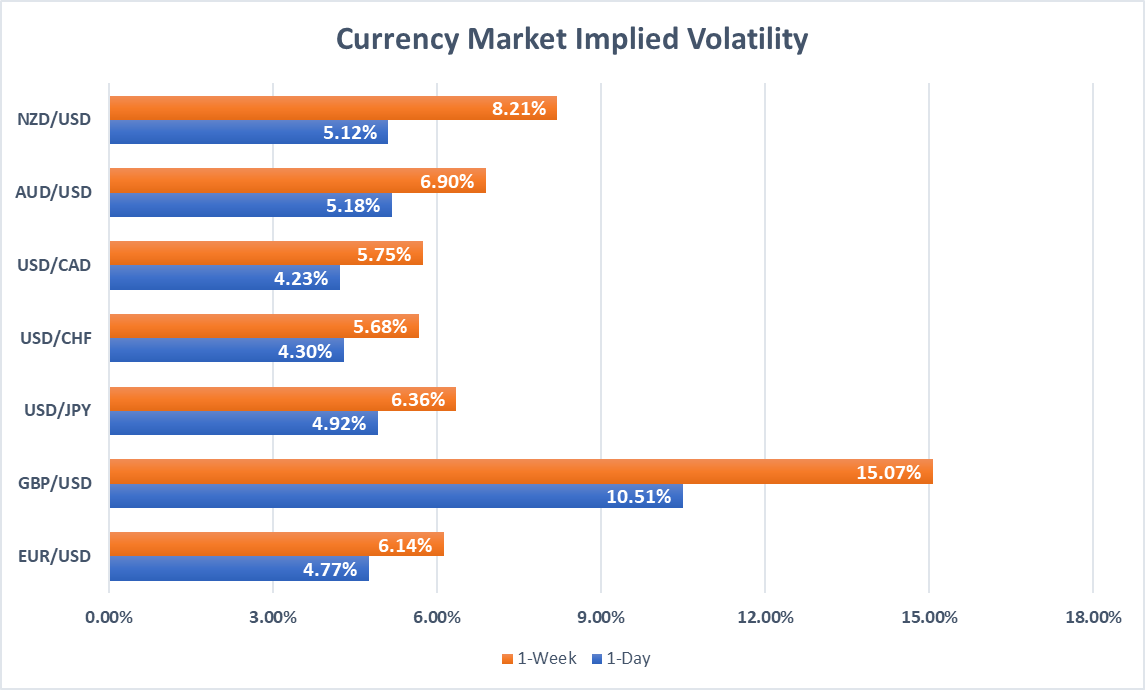
It should come as no surprise that implied volatility on GBP currency pairs remains elevated considering the latest Brexit uncertainty that has sent spot Sterling prices swinging. In fact, GBPUSD 1-week implied volatility was at its highest level in 32-months yesterday. Implied volatility on the Pound has skyrocketed as Brexit approaches the finish line. With the European Council’s offer yesterday to delay the UK’s departure until April 12 at least, GBPUSD traders will likely turn their attention to London where British MPs look to vote on Prime Minister Theresa May’s Brexit Withdrawal Agreement for a third time next week.
EURUSD is another currency pair worth keeping an eye on as the Eurozone and US will both release inflation data which could inject some extra spot price volatility. The Euro has traded in a narrow range against the US Dollar for the last several months, but the continued coiling between rising and falling trendlines has wedged EURUSD into a tight channel that could easy break if sparked by the right catalyst.
EURUSD CURRENCY PRICE CHART: DAILY TIME FRAME (AUGUST 09, 2018 TO MARCH 22, 2019)
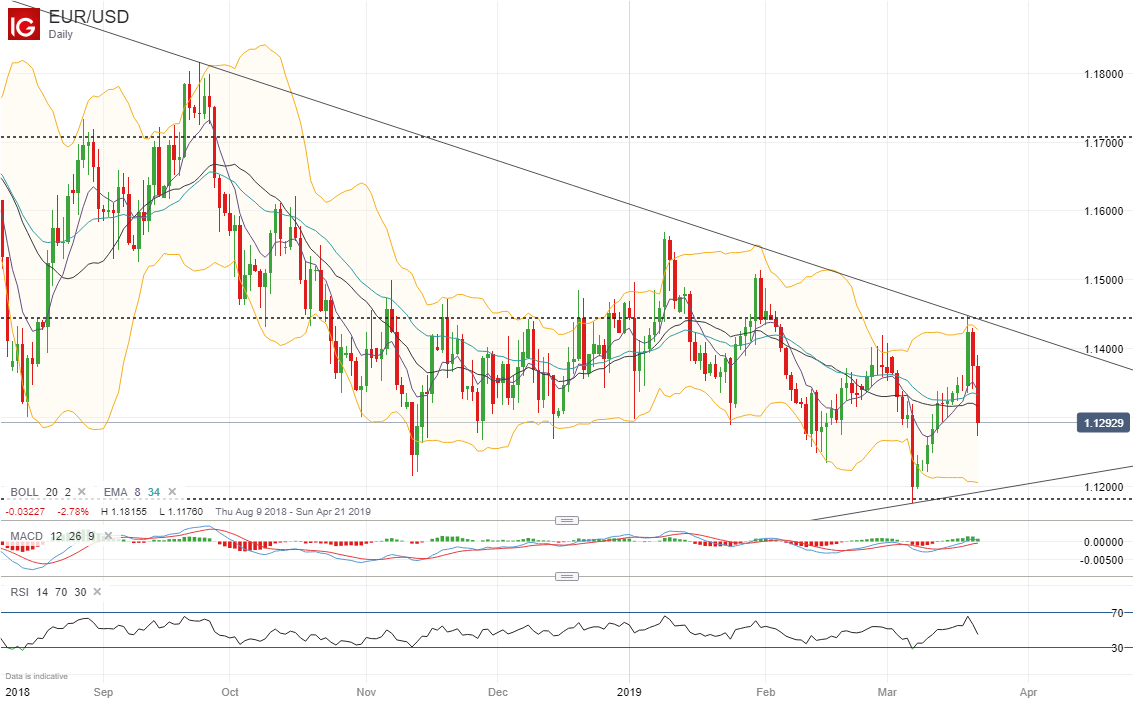
Extraordinarily weak PMI data out of the two areas released earlier today seem to have renewed economic growth concerns and pushed the EURUSD lower. However, a speech from ECB President Mario Draghi slated for next Wednesday could bolster confidence for Euro-bulls. Implied volatility from the 1-week EURUSD options contract suggests a high of 1.1330 and a low of 1.1258 and could be potential levels to watch for spot prices to rebound.
The Japanese Yen has also garnered some attention recently after forex traders reacted to a dovish Federal Reserve who lowered forecasts for economic growth and employment while also announcing an end to balance sheet normalization by September. This sparked a massive selloff in USDJPY post-FOMC on Wednesday as investors flocked into the anti-risk JPY.
USDJPY CURRENCY PRICE CHART: DAILY TIME FRAME (OCTOBER 22, 2018 TO MARCH 22, 2019)
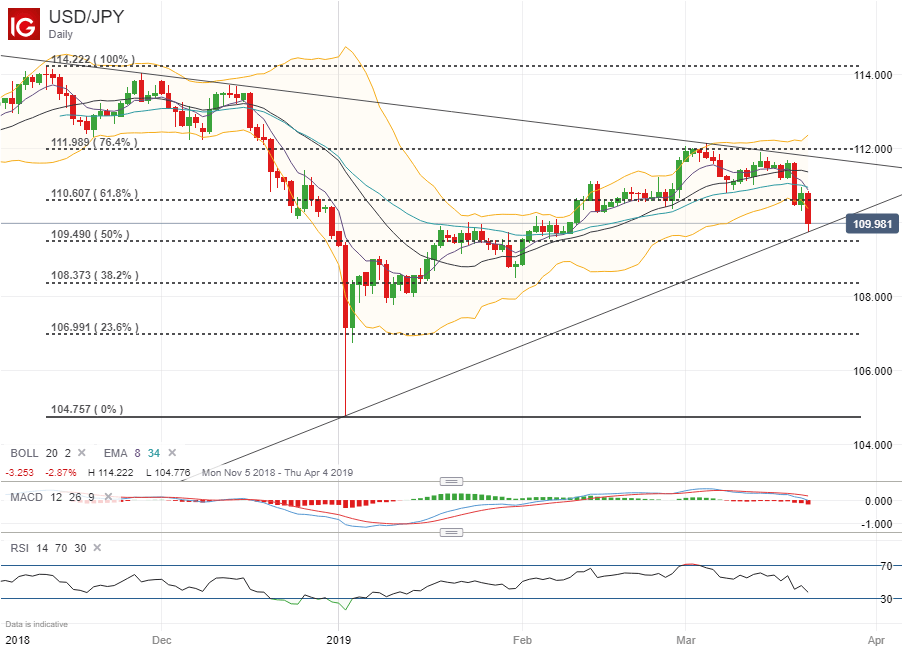
USDJPY appears to have fallen through support at the 61.8 percent Fibonacci line but since bounced off today’s low. The extended upward-sloping trendline drawn from January’s flash crash low to today’s intraday bottom looks to provide the next near-term area of support. Although, currency option traders expect spot USDJPY to remain between 110.4565 and 109.7235 judging by 1-week implied volatility. That being said, upcoming data releases in addition to general market sentiment will likely dictate the currency pair’s next direction.
FOREX ECONOMIC CALENDAR – GBPUSD, EURUSD, USDJPY and USDCAD
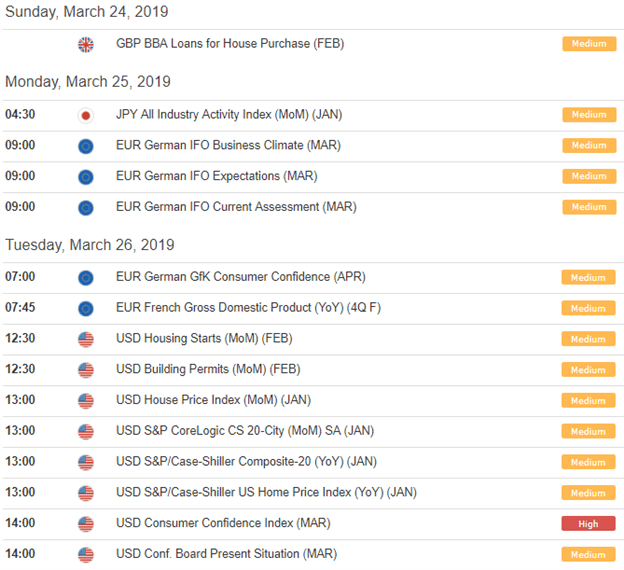
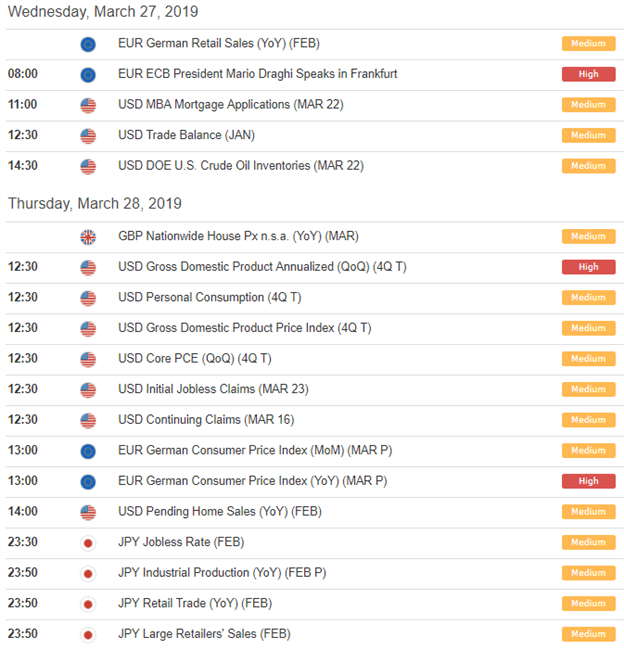
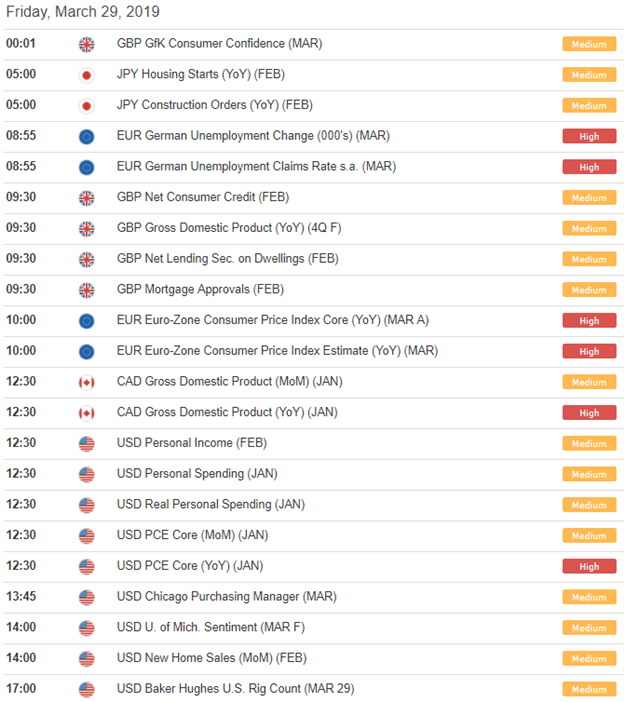
Visit the DailyFX Economic Calendar for a comprehensive list of upcoming economic events and data releases affecting the global markets.
As for the USDCAD, 1-week implied volatility has escalated ahead of Canadian GDP expected next Friday. This high-impact indicator could stir price action for the Canadian Dollar depending on how the actual data print compares to economic estimates. With global growth concerns seemingly re-entering the market, oil could serve as a bellwether to the Loonie’s next direction considering the high correlation between spot CAD and oil prices.
USDCAD CURRENCY PRICE CHART: DAILY TIME FRAME (JANUARY 26, 2018 TO MARCH 22, 2019)
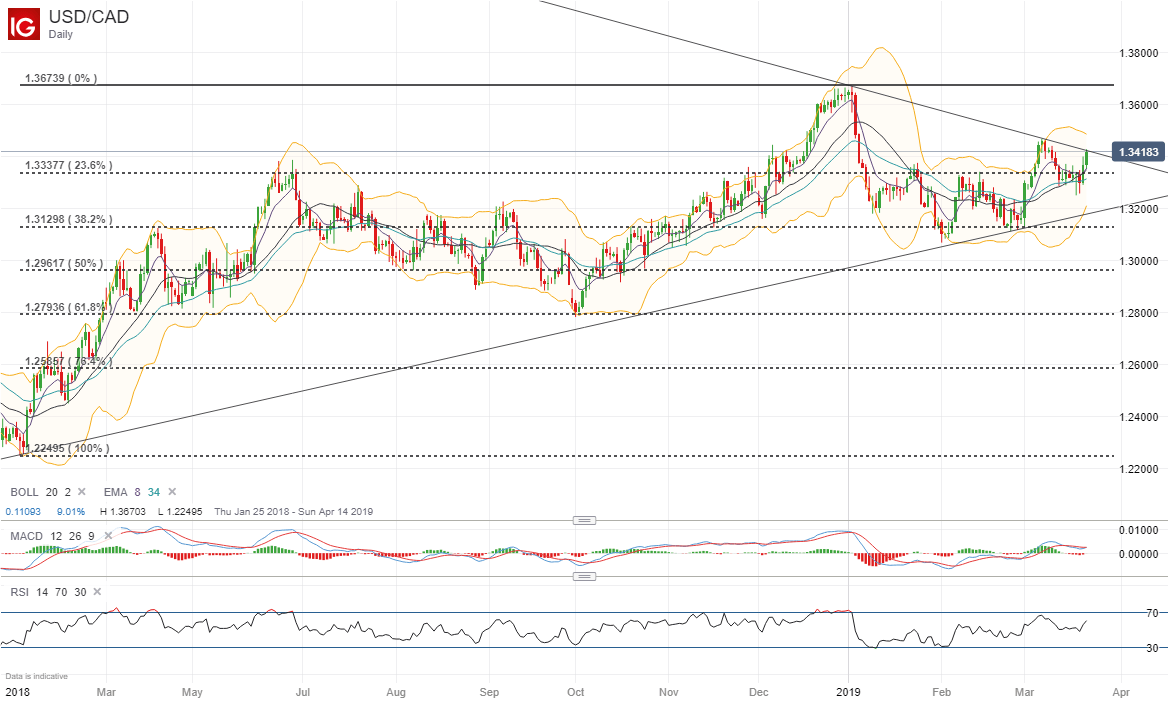
Moreover, after today’s weak inflation reading out of Canada, the country’s relatively hawkish central bank could be sidelined by tame inflation and a moderating economy. After USDCAD spot prices broke above the 23.6 percent Fibonacci retracement line, resistance now looks to the downtrend formed between the high at the beginning of the year and where the forex pair peaked in March. The 1-week implied high derived from USDCAD currency options suggests prices topping out at 1.3441 while 1.3361 is calculated as the 1-week implied low.
- Written by Rich Dvorak, Junior Analyst for DailyFX
- Follow @RichDvorakFX on Twitter


