Get 40% Off
👀 👁 🧿 All eyes on Biogen, up +4,56% after posting earnings. Our AI picked it in March 2024.
Which stocks will surge next?
Unlock AI-picked Stocks

No Change In Market Trends

Published 08/09/2014, 06:13 PM
Updated 07/09/2023, 06:31 AM

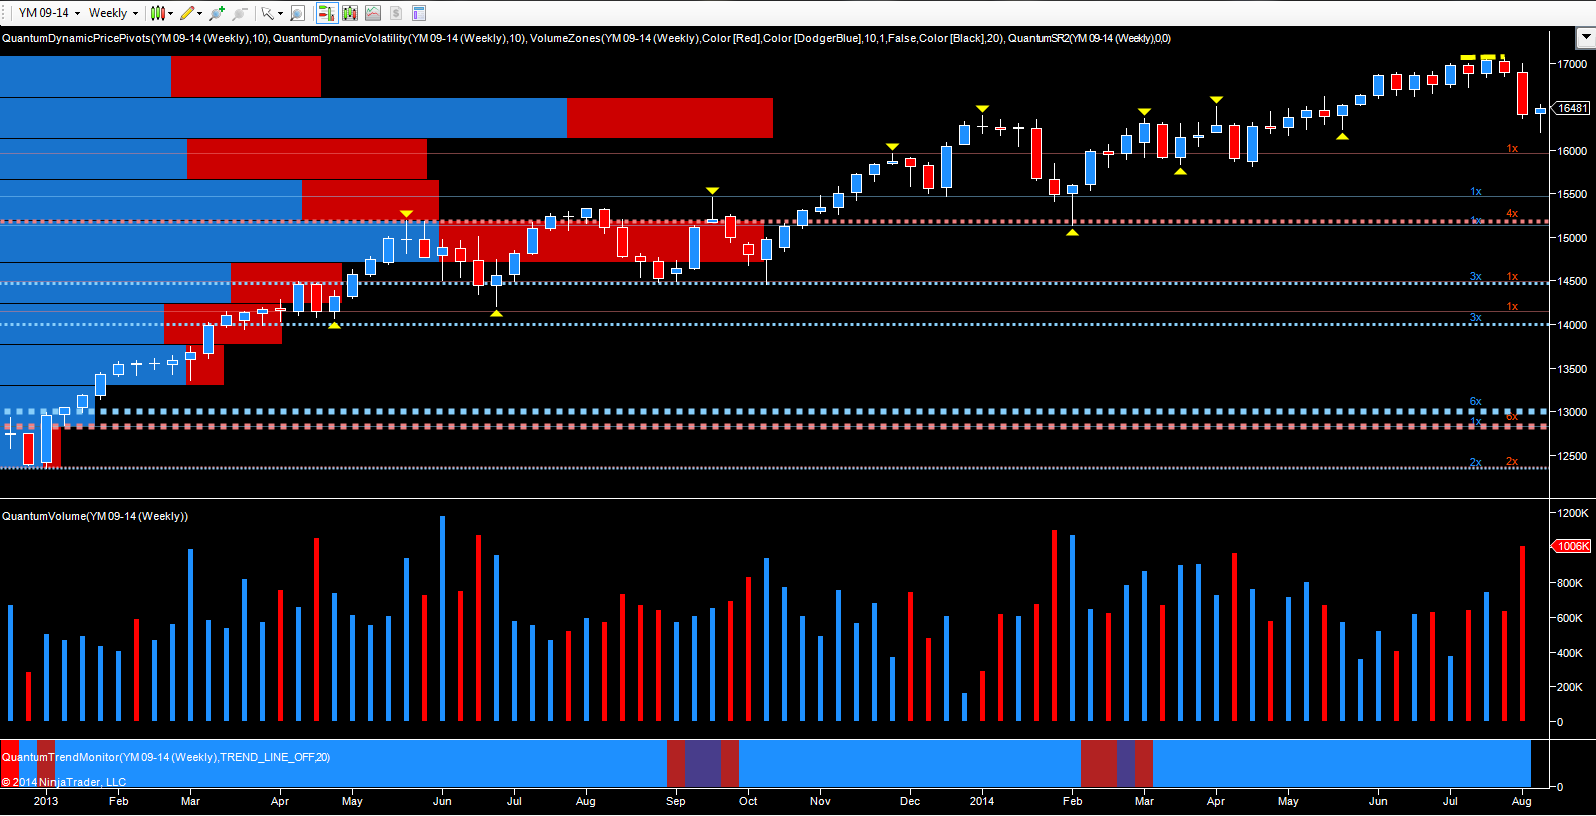
YM Emini – September futures weekly chart

They say a week is a long time in politics, and in the financial markets, the same sentiment could be applied to equity markets, which ended the evening in positive tone, and in sharp contrast to the sharp move lower of two weeks ago. At the time, market commentators were forecasting the ‘end is nigh’ with the big short now underway. I was not one of them and indeed nailed my colors firmly to the mast in a post earlier this week, suggesting that this was simply a long overdue correction, and not a wholesale change in trend. This week’s price action for the major indices has proved the point, with early negative sentiment promptly reversed in today’s bullish price action, with the September futures contract on the YM Emini bouncing back in grand style and closing at 16,479 having tested the 16,500 level towards the close of the session. The weekly chart for the Emini YM neatly encapsulates the last two weeks, with the wide spread down candle of two weeks ago suggesting structural weakness, promptly snuffed out with the hammer candle of this week, which is now suggesting further bullish sentiment to follow in the short term.
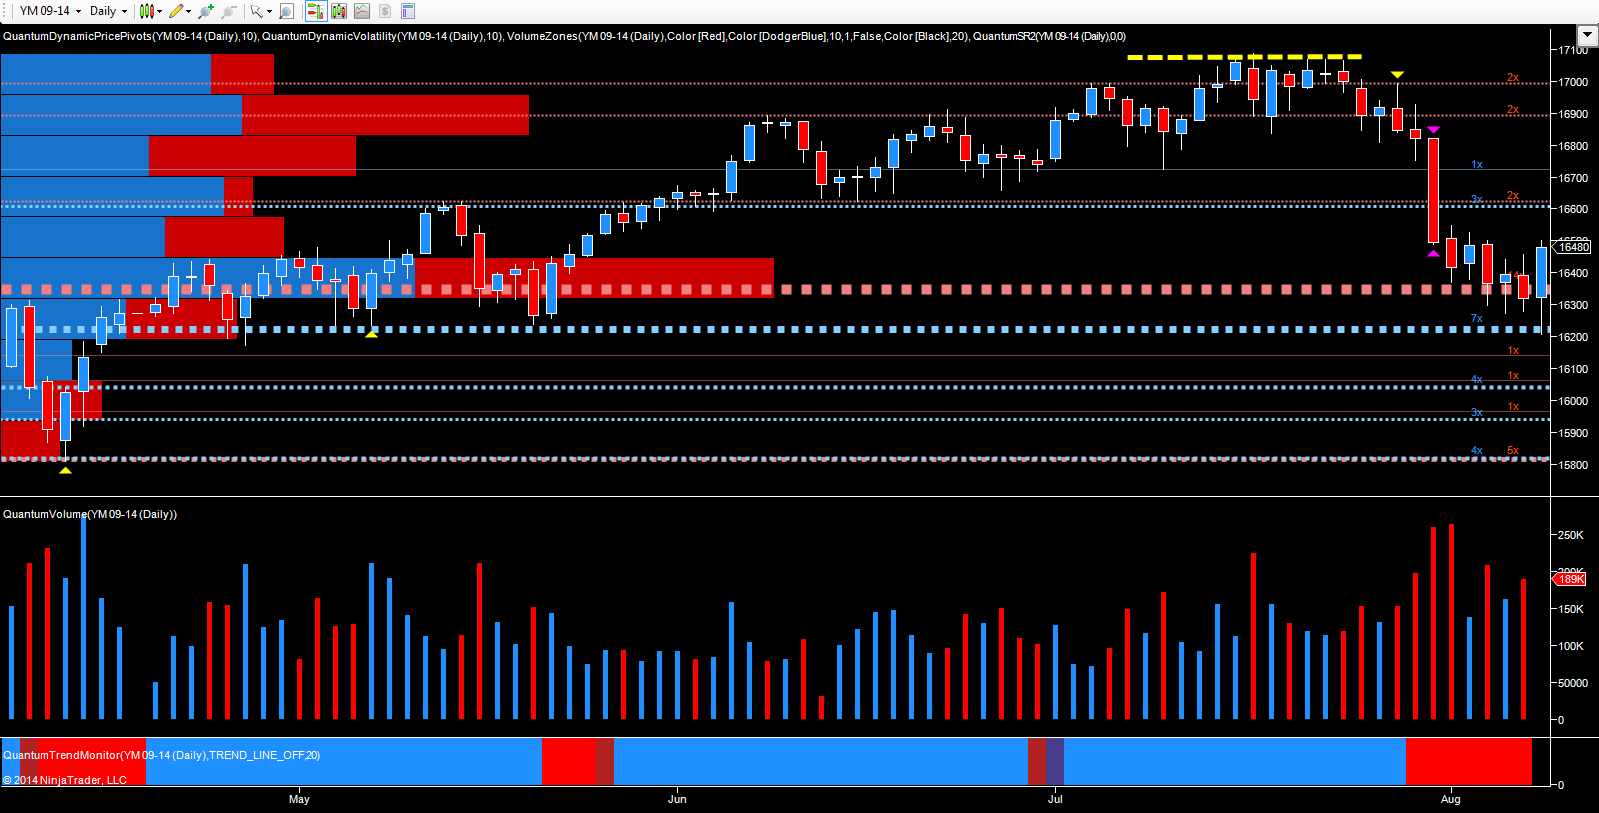
YM Daily

Moving to the daily chart for the YM Emini, today’s price action was a classic in ‘trade what you see and not what you think, with the index falling initially on fears of a US intervention in Iraq and the ongoing tensions in the Middle East and Ukraine, with most traders expecting a further day of heavy selling. Whilst this was certainly true as the European markets opened, later in London, sentiment promptly reversed into the physical open, with initial volumes suggesting only light selling, and duly followed by heavy buying intraday, driving the market higher and recovering the losses of earlier in the week, with the support level at 16,200 providing the springboard for the move higher. With the market now poised to recover its bullish momentum next week, the key resistance level immediately ahead is at the 16,600 region, and provided we see price action supported with strong and rising volumes, then expect to see the index climb higher, and back to test the underside of the deep congestion now sitting in the 16,700 to 17,000 region.

3rd party Ad. Not an offer or recommendation by Investing.com. See disclosure here or remove ads .

Latest comments

Risk Disclosure: Trading in financial instruments and/or cryptocurrencies involves high risks including the risk of losing some, or all, of your investment amount, and may not be suitable for all investors. Prices of cryptocurrencies are extremely volatile and may be affected by external factors such as financial, regulatory or political events. Trading on margin increases the financial risks.
Before deciding to trade in financial instrument or cryptocurrencies you should be fully informed of the risks and costs associated with trading the financial markets, carefully consider your investment objectives, level of experience, and risk appetite, and seek professional advice where needed.
Fusion Media would like to remind you that the data contained in this website is not necessarily real-time nor accurate. The data and prices on the website are not necessarily provided by any market or exchange, but may be provided by market makers, and so prices may not be accurate and may differ from the actual price at any given market, meaning prices are indicative and not appropriate for trading purposes. Fusion Media and any provider of the data contained in this website will not accept liability for any loss or damage as a result of your trading, or your reliance on the information contained within this website.
It is prohibited to use, store, reproduce, display, modify, transmit or distribute the data contained in this website without the explicit prior written permission of Fusion Media and/or the data provider. All intellectual property rights are reserved by the providers and/or the exchange providing the data contained in this website.
Fusion Media may be compensated by the advertisers that appear on the website, based on your interaction with the advertisements or advertisers.
© 2007-2024 - Fusion Media Limited. All Rights Reserved.