


VOLATILITY AND THE GLOBAL MARKETS – TALKING POINTS
- Volatility measures for forex, stock, bond and gold markets jumped this past month as global uncertainty rose
- The relationship of S&P 500 to FX implied volatility (for the Euro, Pound and Yen) could indicate where the stock market might head
- Find out How to Measure Volatility
With the interconnectedness of the global economy, the threat of major risks spilling over from one market to the other is worryingly high. While traders and investors in America tend to obsess over the Cboe S&P 500 Volatility Index, the measure is isolated to the US equity market.
As such, analyzing the S&P 500 Volatility Index alone may not be as indicative of volatility across global asset classes. Rather, a comprehensive look at volatility indicators across forex, emerging markets, treasuries and gold in addition to the VIX may provide more insight for traders.
VOLATILITY EXPECTED FOR SPX, EUR, GBP, JPY, TNX, XAUUSD, EEM PRICE CHART: DAILY TIME FRAME (MAY 01, 2018 TO MAY 16, 2019)
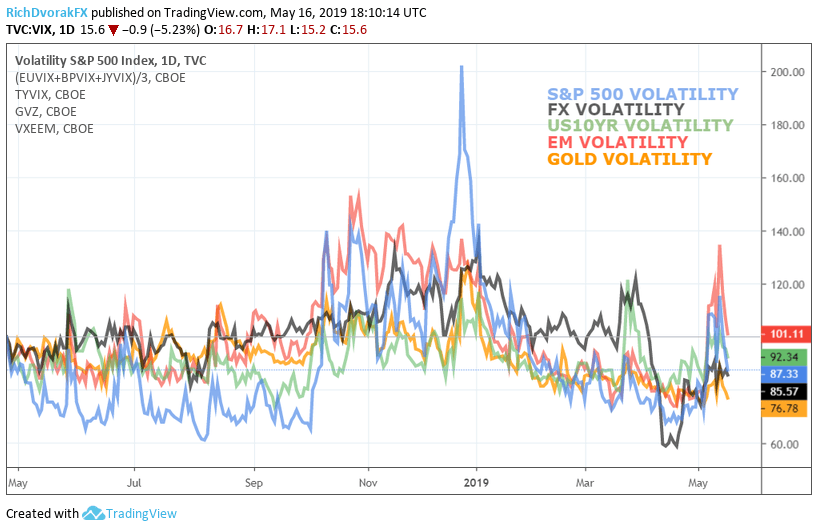
Volatility has jumped off depressed levels recorded last month as uncertainty surrounding several major market risks resurfaced. Over the last few weeks, cross-asset volatility has climbed owing to trade wars, monetary policy, Brexit, and geopolitical concerns flaring up among other notable factors.
Although the S&P 500 volatility and emerging market volatility measures have both receded from their recent spike higher, forex volatility (FXVIX) - measured by an equally-weighted index of the CME’s volatility readings for Euro, British Pound Sterling and Japanese Yen – remains elevated.
VIX TO FXVIX RATIO VERSUS S&P 500 INDEX PRICE CHART: DAILY TIME FRAME (DECEMBER 22, 2017 TO MAY 16, 2019)
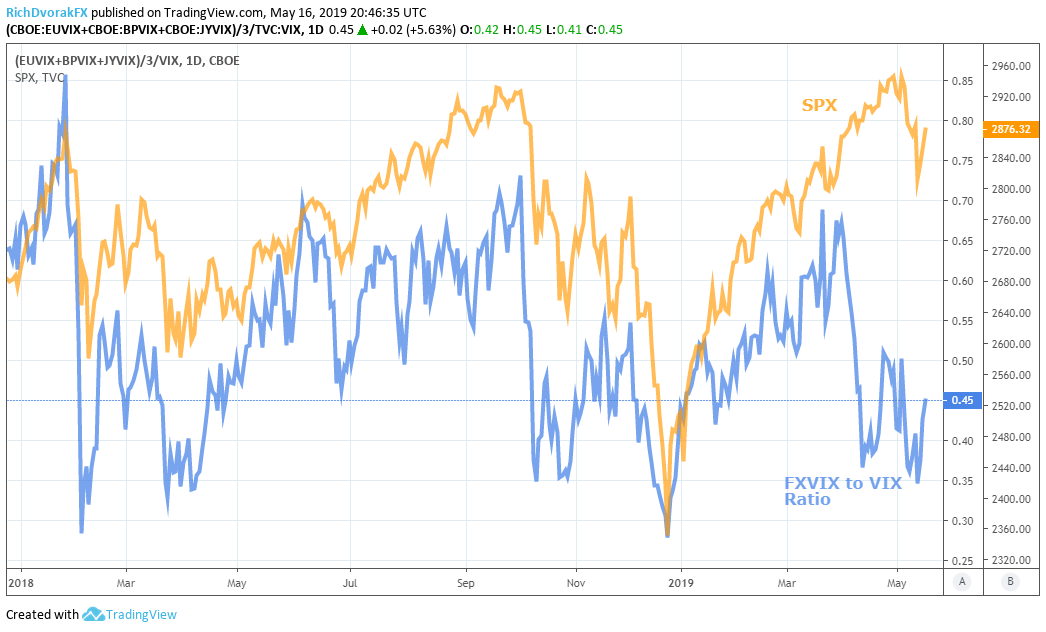
VIX is more susceptible to mean-reversion where large swings typically reverse back toward its recent historical average – in part due to the buy-and-hold nature of the market. On the other hand, FXVIX is generally more steadfast in the sense that it does not abide the same asset caveats as shares or other zero-limited markets. Although these metrics can frequently stray from their historical relationships by temporary means, persistent divergence could be cause for concern.
Considering the international nature of the most pressing risks threatening the markets, the elevated level of forex volatility may be more telling of risks faced by the global financial system. So, while VIX may be the market’s favorite indicator of fear or uncertainty, forex volatility may be more appropriate to measure global risk.
- Written by Rich Dvorak, Junior Analyst for DailyFX
- Follow @RichDvorakFX on Twitter


